| List of Figures |
| Figure 1‑1: Vascular Access Devices and Accessories Market Share Ranking by Segment, Europe, 2022 (1 of 3) |
5 |
| Figure 1‑2: Vascular Access Devices and Accessories Market Share Ranking by Segment, Europe, 2022 (2 of 3) |
5 |
| Figure 1‑3: Vascular Access Devices and Accessories Market Share Ranking by Segment, Europe, 2022 (3 of 3) |
5 |
| Figure 1‑4: Companies Researched in This Report (1 of 2) |
6 |
| Figure 1‑5: Companies Researched in This Report (2 of 2) |
7 |
| Figure 1‑6: Factors Impacting the Vascular Access Devices and Accessories Market by Segment, Europe (1 of 3) |
8 |
| Figure 1‑7: Factors Impacting the Vascular Access Devices and Accessories Market by Segment, Europe (2 of 3) |
9 |
| Figure 1‑8: Factors Impacting the Vascular Access Devices and Accessories Market by Segment, Europe (3 of 3) |
10 |
| Figure 1‑9: Recent Events in the Vascular Access Devices and Accessories Market, Europe, 2019 – 2023 (1 of 2) |
11 |
| Figure 1‑10: Recent Events in the Vascular Access Devices and Accessories Market, Europe, 2019 – 2023 (2 of 2) |
12 |
| Figure 1‑11: Vascular Access Devices and Accessories Procedures Covered, Europe |
13 |
| Figure 1‑12: Vascular Access Devices and Accessories Markets Covered, Europe (1 of 4) |
14 |
| Figure 1‑13: Vascular Access Devices and Accessories Markets Covered, Europe (2 of 4) |
15 |
| Figure 1‑14: Vascular Access Devices and Accessories Markets Covered, Europe (3 of 4) |
16 |
| Figure 1‑15: Vascular Access Devices and Accessories Markets Covered, Europe (4 of 4) |
17 |
| Figure 1‑16: Key Report Updates (1 of 2) |
18 |
| Figure 1‑17: Key Report Updates (2 of 2) |
19 |
| Figure 1‑18: Version History |
20 |
| Figure 2‑1: Vascular Access Devices and Accessories Market by Segment, Worst Case Scenario, Europe, 2019 – 2029 (€M) (1 of 3) |
38 |
| Figure 2‑2: Vascular Access Devices and Accessories Market by Segment, Worst Case Scenario, Europe, 2019 – 2029 (€M) (2 of 3) |
39 |
| Figure 2‑3: Vascular Access Devices and Accessories Market by Segment, Worst Case Scenario, Europe, 2019 – 2029 (€M) (3 of 3) |
40 |
| Figure 2‑4: Vascular Access Devices and Accessories Vascular Access Devices and Accessories Market by Segment, Base Case Scenario, Europe, 2019 – 2029 (€M) (1 of 3) |
41 |
| Figure 2‑5: Vascular Access Devices and Accessories Market by Segment, Base Case Scenario, Europe, 2019 – 2029 (€M) (2 of 3) |
42 |
| Figure 2‑6: Vascular Access Devices and Accessories Market by Segment, Base Case Scenario, Europe, 2019 – 2029 (€M) (3 of 3) |
43 |
| Figure 2‑7: Vascular Access Devices and Accessories Market by Segment, Best Case Scenario, Europe, 2019 – 2029 (€M) (1 of 3) |
44 |
| Figure 2‑8: Vascular Access Devices and Accessories Market by Segment, Best Case Scenario, Europe, 2019 – 2029 (€M) (2 of 3) |
45 |
| Figure 2‑9: Vascular Access Devices and Accessories Market by Segment, Best Case Scenario, Europe, 2019 – 2029 (€M) (3 of 3) |
46 |
| Figure 4‑1: Implantable Ports by Company |
68 |
| Figure 4‑2: Port Needles by Company (1 of 2) |
69 |
| Figure 4‑3: Port Needles by Company (2 of 2) |
70 |
| Figure 4‑4: Central Venous Catheters by Company |
73 |
| Figure 4‑5: Peripherally Inserted Central Catheters by Company |
75 |
| Figure 4‑6: Peripheral Intravenous Catheters by Company |
77 |
| Figure 4‑7: Midlines by Company |
78 |
| Figure 4‑8: Extended Dwell Catheter by Company |
79 |
| Figure 4‑9: Dialysis Catheters by Company (1 of 2) |
82 |
| Figure 4‑10: Dialysis Catheters by Company (2 of 2) |
83 |
| Figure 4‑11: Ultrasound Vascular Access Devices and Accessories by Company |
86 |
| Figure 4‑12: Tip-Placement System and Accessories by Company |
88 |
| Figure 4‑13: Catheter Securement by Company (1 of 2) |
90 |
| Figure 4‑14: Catheter Securement by Company (2 of 2) |
91 |
| Figure 4‑15: Antibacterial Catheter Patch by Company |
92 |
| Figure 4‑16: Catheter Cap by Company |
93 |
| Figure 4‑17: Syringes and Needles by Company (1 of 2) |
95 |
| Figure 4‑18: Syringes and Needles by Company (2 of 2) |
96 |
| Figure 4‑19: Vein Visualization by Company |
97 |
| Figure 4‑20: Class 2 Device Recall PowerPort duo M.R.I. Implantable Port |
98 |
| Figure 4‑21: Class 2 Device Recall Smart Port CT |
98 |
| Figure 4‑22: Class 2 Device Recall PORTACATH II POWER P.A.C. Low Profile" System |
98 |
| Figure 4‑23: Class 2 Device Recall BARD Access Systems PowerPort ClearVUE Slim Implantable Port |
99 |
| Figure 4‑24: Class 2 Device Recall Vaccess CT PowerInjectable Implantable Port |
99 |
| Figure 4‑25: Class 2 Device Recall XPort isp M.R.I. Implantable Port |
99 |
| Figure 4‑26: Class 2 Device Recall Power Port Implantable Port |
99 |
| Figure 4‑27: Class 2 Device Recall PowerPort M.R.I. Implantable Port |
100 |
| Figure 4‑28: Class 2 Device Recall BardPort Titanium Implantable Port |
100 |
| Figure 4‑29: Class 2 Device Recall BardPort M.R.I. Hard Base Implantable Port |
100 |
| Figure 4‑30: Class 2 Device Recall Powerport Cleavue Slim Implantable Port |
100 |
| Figure 4‑31: Class 2 Device Recall Bard Access Systems PowerPort isp M.R.I. Implantable Port |
101 |
| Figure 4‑32: Class 2 Device Recall BioFlo Port with ENDEXO and PASV Technology |
101 |
| Figure 4‑33: Class 2 Device Recall Port Access Kit |
102 |
| Figure 4‑34: Class 2 Device Recall SafeStep Huber Needle Set |
102 |
| Figure 4‑35: Class 2 Device Recall PowerLoc MAX Power |
103 |
| Figure 4‑36: Class 2 Device Recall GRIPPER Needles |
103 |
| Figure 4‑37: Class 1 Device Recall Arrow Pressure Injectable Arrowgard Blue Plus ThreeLumen CVC Kit |
104 |
| Figure 4‑38: Class 2 Device Recall Arrow ThreeLumen CVC |
104 |
| Figure 4‑39: Class 2 Device Recall Arrow Teleflex |
104 |
| Figure 4‑40: Class 2 Device Recall Groshong CV Catheter |
105 |
| Figure 4‑41: Class 2 Device Recall Centurion |
105 |
| Figure 4‑42: Class 2 Device Recall Arrow AGB MultiLumen CVC Kit |
105 |
| Figure 4‑43: Class 2 Device Recall ARROWgard Blue Plus |
105 |
| Figure 4‑44: Class 2 Device Recall ARROWgard Blue Plus MultiLumen CVC Kit |
106 |
| Figure 4‑45: Class 2 Device Recall PICC KIT |
107 |
| Figure 4‑46: Class 2 Device Recall Various PICC Line, Central Line Packs |
107 |
| Figure 4‑47: Class 2 Device Recall Navilyst |
107 |
| Figure 4‑48: Class 2 Device Recall 5Fr PowerPICC Catheter SingleLumen with 70cm Guidewire |
107 |
| Figure 4‑49: Class 2 Device Recall BioFlo and Xcela |
108 |
| Figure 4‑50: Class 2 Device Recall Arrow PICC |
108 |
| Figure 4‑51: Class 2 Device Recall Arrow Pressure Injectable PICC |
109 |
| Figure 4‑52: Class 2 Device Recall Navilyst Medical BioFlo PICC with ENDEXO and PASV |
109 |
| Figure 4‑53: Class 2 Device Recall BD Nexiva Closed IV Catheter System |
110 |
| Figure 4‑54: Class 2 Device Recall BD Nexiva 20 GA 1.00 (1.1 x 25mm) Dual Port |
110 |
| Figure 4‑55: Class 2 Device Recall DELTAVEN Safety I.V. Catheter in Pur with closed system |
110 |
| Figure 4‑56: Class 2 Device Recall B. Braun Introcan Safety IV Catheters |
111 |
| Figure 4‑57: Class 2 Device Recall BD Nexiva Closed IV Catheter System Dual Port |
111 |
| Figure 4‑58: Class 2 Device Recall BD Nexiva Closed IV Catheter System |
111 |
| Figure 4‑59: Class 2 Device Recall Jelco(R) ViaValve(TM) Safety Intravenous (I.V.) Catheters |
111 |
| Figure 4‑60: Class 2 Device Recall ARROW Pressure Injectable Arrowgard Blue Advance Midline Kit |
112 |
| Figure 4‑61: Class 2 Device Recall PowerMidline Catheter |
112 |
| Figure 4‑62: Class 2 Device Recall BioFlo Midline |
112 |
| Figure 4‑63: Class 2 Device Recall PowerGlide ST Midline Catheter Maximal Barrier |
112 |
| Figure 4‑64: Class 2 Device Recall Arrowgard Blue Advance Midline |
113 |
| Figure 4‑65: Class 2 Device Recall Peripherally Inserted Midline Catheter Kit with Placement Wire |
113 |
| Figure 4‑66: Class 3 Device Recall POWERWAND XL 4Fr 10cm Maximum Barrier Kit |
114 |
| Figure 4‑67: Class 2 Device Recall Arrow Endurance Catheter System |
114 |
| Figure 4‑68: Class 1 Device Recall Mahurkar |
115 |
| Figure 4‑69: Class 1 Device Recall Hemodialysis Catheter |
115 |
| Figure 4‑70: Class 2 Device Recall Hemodialysis Implanted Catheter |
115 |
| Figure 4‑71: Class 2 Device Recall PowerTrialysis ShortTerm Alphacurve Dialysis Catheter |
115 |
| Figure 4‑72: Class 2 Device Recall EQUISTREAM LongTerm Hemodialysis Catheter |
116 |
| Figure 4‑73: Class 2 Device Recall GLIDEPATH LongTerm Hemodialysis Catheter |
116 |
| Figure 4‑74: Class 2 Device Recall 14F SLX Double Lumen Full Tray |
116 |
| Figure 4‑75: Class 2 Device Recall MAHURKAR" and Argyle" Acute Hemodialysis Catheters |
117 |
| Figure 4‑76: Class 2 Device Recall 14F SLX Double Lumen Full Tray |
117 |
| Figure 4‑77: Class 2 Device Recall Vivid |
118 |
| Figure 4‑78: Class 2 Device Recall ACUSON Juniper Diagnostic Ultrasound System |
118 |
| Figure 4‑79: Class 2 Device Recall Vscan Extend System, Imaging, Pulsed Echo, Ultrasonic |
119 |
| Figure 4‑80: Class 2 Device Recall AC/DC POWER SUPPLY for 7400 |
119 |
| Figure 4‑81: Class 2 Device Recall SiteRite 8 Ultrasound Systems |
119 |
| Figure 4‑82: Class 2 Device Recall VPS Rhythm ECG Accessory Pack |
120 |
| Figure 4‑83: Class 2 Device Recall Busse I.V. START KIT |
121 |
| Figure 4‑84: Class 2 Device Recall MERSILK and PERMAHAND, Braided Silk and Virgin Silk NonAbsorbable Suture |
121 |
| Figure 4‑85: Class 2 Device Recall Coated VICRYL (Polyglactin 910) Suture |
121 |
| Figure 4‑86: Class 2 Device Recall ETHIBOND EXCEL ETHIBOND Polyester Suture |
122 |
| Figure 4‑87: Class 2 Device Recall 3M Durapore Advanced Surgical Tape |
122 |
| Figure 4‑88: Class 2 Device Recall HEB InControl Insulin Syringe |
123 |
| Figure 4‑89: Class 1 Device Recall Monoject 0.9 Sodium Chloride Flush Syringe |
123 |
| Figure 4‑90: Class 1 Device Recall JELCO HYPODERMIC NEEDLEPRO FIXED NEEDLE INSULIN SYRINGE |
123 |
| Figure 4‑91: Class 2 Device Recall Covidien |
124 |
| Figure 4‑92: Class 2 Device Recall BD PrecisionGlide Needle 30G x 1/2 |
124 |
| Figure 4‑93: Class 2 Device Recall BD UltraFine Pen Needles 32G x 4mm |
124 |
| Figure 4‑94: Class 2 Device Recall Monoject Standard Hypodermic Needle |
124 |
| Figure 4‑95: Class 2 Device Recall BD SafetyGlideTM 3ml 25G x 1 |
125 |
| Figure 4‑96: Class 2 Device Recall Monoject Hypodermic Safety Needle |
125 |
| Figure 4‑97: Class 2 Device Recall GRIPPER Needles |
125 |
| Figure 4‑98: Class 2 Device Recall 3mL SafetyLok Syringe |
125 |
| Figure 4‑99: Class 2 Device Recall 3mL LuerLok Syringe |
126 |
| Figure 4‑100: Safety of Extending the Routine Flushing of Implanted Port Devices from 4 Weeks to 12 |
128 |
| Figure 4‑101: Interest of Virtual Reality to Reduce Patient Anxiety During the Placement of a Percutaneous Implantable Port Catheter (RV-CIP) |
128 |
| Figure 4‑102: A Retrospective, Observational, Multicenter Study to Evaluate the Safety and Performance of POLYSITE® and SEESITE® Implantable Ports |
129 |
| Figure 4‑103: Comparison Between Internal Jugular Vein Versus Axillary Vein for Implantable Ports |
129 |
| Figure 4‑104: Maintaining Patency in Implanted Port Catheters |
129 |
| Figure 4‑105: Ultrasound Guided Port-A-Cath Insertion in Cancer Patients |
130 |
| Figure 4‑106: Study on Indications of "Bard" PowerPort Isp Implantable Port (BPIP) |
130 |
| Figure 4‑107: Wire-in-needle vs. Traditional Technique for Ultrasound-Guided Central Venous Catheter Placement |
131 |
| Figure 4‑108: Central Venous Catheter-Related Complications in Patients Under Anticancer Treatment (KTcCHO) |
131 |
| Figure 4‑109: Infection Related to Short-Term Central Venous Catheters |
132 |
| Figure 4‑110: Point of Care Ultrasonography Versus Standard Blind Technique for Central Venous Catheter Insertion in Emergency Hospital |
132 |
| Figure 4‑111: Central Venous Catheter (CVC) Associated Deep Vein Thrombosis (DVT) in Cancer Patients |
132 |
| Figure 4‑112: Novel Strategy to Encourage Early Removal of Central Venous Catheters |
133 |
| Figure 4‑113: Novel Strategy to Encourage Early Removal of Central Venous Catheters |
133 |
| Figure 4‑114: Peripherally Inserted Versus Centrally Inserted Central Venous Catheters in the Neurosurgical Intensive Care Unit (PICINI) |
133 |
| Figure 4‑115: Comparing Peripherally Inserted Central Catheters to Long Peripheral Catheters in Pediatrics (ComPLET) |
134 |
| Figure 4‑116: Comparing Arrow PICC Catheters w/ Arrowga+rd Blue Advanced Protection Performance and Safety to Unprotected PICC's |
134 |
| Figure 4‑117: Prospective Observational Study of the Power PICC Family of Devices and Accessories |
135 |
| Figure 4‑118: Peripherally Inserted Central Catheter Insertion Site and Complication Rate in Neonates |
135 |
| Figure 4‑119: Major Complications Related to PICC and Midline Insertion (PICC/MIDLINE) |
135 |
| Figure 4‑120: Safety and Effectiveness of CATHTONG™ II PICC |
136 |
| Figure 4‑121: Ultrasound-Guided Peripheral Intravenous Catheter Insertion Technique (PIVC) |
137 |
| Figure 4‑122: Comparison of Two Peripheral Inserted Intravenous Catheters |
137 |
| Figure 4‑123: Impact of PIVC Length and Gauge on Catheter Indwell Time |
137 |
| Figure 4‑124: Impact of a Multimodal Intervention on Peripheral Venous Catheterization of Cancer Patients (MultiCat) |
138 |
| Figure 4‑125: Peripheral Intravenous Catheter Securement with Tissue Adhesive |
138 |
| Figure 4‑126: Peripherally Inserted Versus Centrally Inserted Central Venous Catheters in the Neurosurgical Intensive Care Unit (PICINI) |
138 |
| Figure 4‑127: Midline Catheter and Its Impact on Central Lines Removal in ICU (MIDREA) |
139 |
| Figure 4‑128: Patient Perspective Midline Catheter in the Emergency Department |
139 |
| Figure 4‑129: Midline Failures: A Comparison Between a Hydrophilic Biomaterial and Thermoplastic Polyurethane |
139 |
| Figure 4‑130: Safety and Efficacy of Midline and PICC (MidLine_PICC) |
140 |
| Figure 4‑131: Midlines and Thrombophlebitis |
140 |
| Figure 4‑132: Midline Catheter and Its Impact on Central Lines Removal in ICU (MIDREA) |
140 |
| Figure 4‑133: Upper Limb Thrombosis Associated With Midline Catheter |
141 |
| Figure 4‑134: The Clinical Efficacy of Midline Catheters |
141 |
| Figure 4‑135: Occurrence of Emerging Infections After Placement of a Peritoneal Dialysis CatHeter (SINEPHILE) |
142 |
| Figure 4‑136: Tunneled Dialysis Catheters Versus Non-Tunneled Dialysis Catheters as First-Line for Renal Replacement Therapy in the ICU (BACKDOOR) |
142 |
| Figure 4‑137: Straight Versus Coiled Peritoneal Dialysis Catheter for Peritoneal Dialysis Patients |
142 |
| Figure 4‑138: A Percutaneous Ultrasound Device with Needle Guide for Vascular Access |
143 |
| Figure 4‑139: Ultrasound Guided Peripheral Catheterization Increases First-Attempt Success Rate (SPECTRA) |
143 |
| Figure 4‑140: Ultrasound-Guided Peripheral IV vs. Standard Technique in Difficult Vascular Access Patients by ICU Nurses |
144 |
| Figure 4‑14144: Innovative Central Line Securement Device in the Pediatric Population |
145 |
| Figure 4‑142: Efficacy of an Infrared Visualization Technique for the Identification of the Peripheral Venous Access Site in Patients with Cystic Fibrosis Aged 12 Years and Older (MUCOVEINE) |
148 |
| Figure 4‑143: Infra Red Vein Visualization: Efficacy vs. Standard Technique |
148 |
| Figure 4‑144: Can Veinlite Reduce Complications of Peripheral Intravenous Catheter Placement in Children |
149 |
| Figure 5‑1: Currency Exchange Rate, 2022 |
151 |
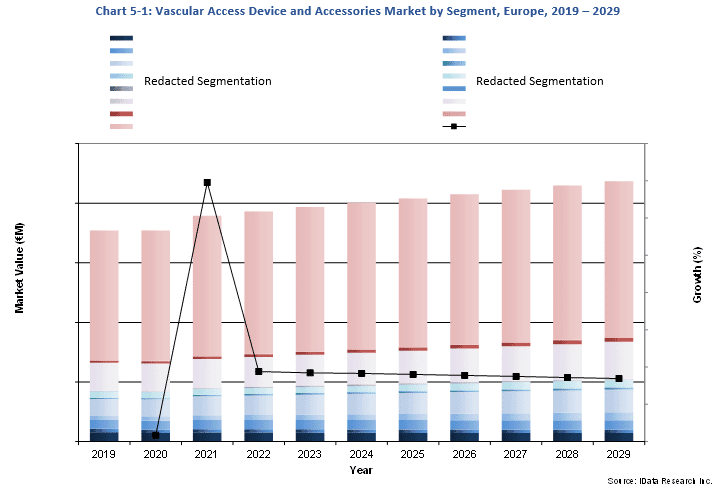
| Figure 5‑2: Vascular Access Devices and Accessories Market by Segment, Europe, 2019 – 2029 (€M) (1 of 3) |
154 |
| Figure 5‑3: Vascular Access Devices and Accessories Market by Segment, Europe, 2019 – 2029 (€M) (2 of 3) |
155 |
| Figure 5‑4: Vascular Access Devices and Accessories Market by Segment, Europe, 2019 – 2029 (€M) (3 of 3) |
156 |
| Figure 5‑5: Vascular Access Devices and Accessories Market by Segment, Europe, 2019 – 2029 (US$M) (1 of 3) |
157 |
| Figure 5‑6: Vascular Access Devices and Accessories Market by Segment, Europe, 2019 – 2029 (US$M) (2 of 3) |
158 |
| Figure 5‑7: Vascular Access Devices and Accessories Market by Segment, Europe, 2019 – 2029 (US$M) (3 of 3) |
159 |
| Figure 5‑8: Leading Competitors, Vascular Access Device and Accessories Market, Europe, 2022 (1 of 2) |
169 |
| Figure 5‑9: Leading Competitors, Vascular Access Device and Accessories Market, Europe, 2022 (2 of 2) |
170 |
| Figure 5‑10: SWOT Analysis, 3M |
189 |
| Figure 5‑11: SWOT Analysis, AccuVein |
190 |
| Figure 5‑12: SWOT Analysis, AngioDynamics |
191 |
| Figure 5‑13: SWOT Analysis, B. Braun |
192 |
| Figure 5‑14: SWOT Analysis, Becton Dickinson (1 of 2) |
193 |
| Figure 5‑15: SWOT Analysis, Becton Dickinson (2 of 2) |
194 |
| Figure 5‑16: SWOT Analysis, Cardinal Health |
195 |
| Figure 5‑17: SWOT Analysis, ICU Medical |
196 |
| Figure 5‑18: SWOT Analysis, Johnson & Johnson |
197 |
| Figure 5‑19: SWOT Analysis, Medcomp |
198 |
| Figure 5‑20: SWOT Analysis, Novo Nordisk |
199 |
| Figure 5‑21: SWOT Analysis, Teleflex Medical |
200 |
| Figure 7‑1: Vascular Access Procedures by Segment, Europe, 2019 – 2029 (1 of 2) |
213 |
| Figure 7‑2: Vascular Access Procedures by Segment, Europe, 2019 – 2029 (2 of 2) |
213 |
| Figure 7‑3: Vascular Access Procedures by Country, Europe, 2019 – 2029 (1 of 2) |
214 |
| Figure 7‑4: Vascular Access Procedures by Country, Europe, 2019 – 2029 (2 of 2) |
214 |
| Figure 7‑5: Implantable Port Insertion Procedures by Country, Europe, 2019 – 2029 |
217 |
| Figure 7‑6: Non-Power-Injectable Implantable Port Insertion Procedures by Country, Europe, 2019 – 2029 |
218 |
| Figure 7‑7: Power-Injectable Implantable Port Insertion Procedures by Country, Europe, 2019 – 2029 |
219 |
| Figure 7‑8: Port Needle Insertion Procedures by Country, Europe, 2019 – 2029 |
221 |
| Figure 7‑9: Conventional Port Needle Insertion Procedures by Country, Europe, 2019 – 2029 |
222 |
| Figure 7‑10: Safety Port Needle Insertion Procedures by Country, Europe, 2019 – 2029 |
223 |
| Figure 7‑11: CVC Insertion Procedures by Country, Europe, 2019 – 2029 |
225 |
| Figure 7‑12: Acute CVC Insertion Procedures by Country, Europe, 2019 – 2029 |
226 |
| Figure 7‑13: Chronic CVC Insertion Procedures by Country, Europe, 2019 – 2029 |
227 |
| Figure 7‑14: PICC Insertion Procedures by Country, Europe, 2019 – 2029 |
229 |
| Figure 7‑15: Non-Power-Injectable PICC Insertion Procedures by Country, Europe, 2019 – 2029 |
230 |
| Figure 7‑16: Power-Injectable PICC Insertion Procedures by Country, Europe, 2019 – 2029 |
231 |
| Figure 7‑17: PIVC Insertion Procedures by Country, Europe, 2019 – 2029 (1 of 2) |
233 |
| Figure 7‑18: PIVC Insertion Procedures by Country, Europe, 2019 – 2029 (2 of 2) |
233 |
| Figure 7‑19: Conventional PIVC Insertion Procedures by Country, Europe, 2019 – 2029 |
234 |
| Figure 7‑20: Safety PIVC Insertion Procedures by Country, Europe, 2019 – 2029 (1 of 2) |
235 |
| Figure 7‑21: Safety PIVC Insertion Procedures by Country, Europe, 2019 – 2029 (2 of 2) |
235 |
| Figure 7‑22: Midline Catheter Insertion Procedures by Country, Europe, 2019 – 2029 |
237 |
| Figure 7‑23: MST Midline Catheter Insertion Procedures by Country, Europe, 2019 – 2029 |
238 |
| Figure 7‑24: AST Midline Catheter Insertion Procedures by Country, Europe, 2019 – 2029 |
239 |
| Figure 7‑25: Dialysis Catheter Insertion Procedures by Country, Europe, 2019 – 2029 |
241 |
| Figure 7‑26: Long-Term Hemodialysis Catheter Insertion Procedures by Country, Europe, 2019 – 2029 |
242 |
| Figure 7‑27: Short-Term Hemodialysis Catheter Insertion Procedures by Country, Europe, 2019 – 2029 |
243 |
| Figure 7‑28: Peritoneal Dialysis Catheter Insertion Procedures by Country, Europe, 2019 – 2029 |
244 |
| Figure 8‑1: Implantable Port Market by Device Type, Europe, 2019 – 2029 (€M) |
247 |
| Figure 8‑2: Implantable Port Market by Device Type, Europe, 2019 – 2029 (US$M) |
247 |
| Figure 8‑3: Total Implantable Port Market, Europe, 2019 – 2029 |
250 |
| Figure 8‑4: Units Sold by Country, Implantable Port Market, Europe, 2019 – 2029 |
251 |
| Figure 8‑5: Average Selling Price by Country, Implantable Port Market, Europe, 2019 – 2029 (€) |
252 |
| Figure 8‑6: Average Selling Price by Country, Implantable Port Market, Europe, 2019 – 2029 (US$) |
253 |
| Figure 8‑7: Market Value by Country, Implantable Port Market, Europe, 2019 – 2029 (€M) |
254 |
| Figure 8‑8: Market Value by Country, Implantable Port Market, Europe, 2019 – 2029 (US$M) |
255 |
| Figure 8‑9: Non-Power-Injectable Implantable Port Market by Segment, Europe, 2019 – 2029 (€M) |
257 |
| Figure 8‑10: Non-Power-Injectable Implantable Port Market by Segment, Europe, 2019 – 2029 (US$M) |
258 |
| Figure 8‑11: Total Non-Power-Injectable Implantable Port Market, Europe, 2019 – 2029 |
258 |
| Figure 8‑12: Units Sold by Country, Total Non-Power-Injectable Implantable Port Market, Europe, 2019 – 2029 |
259 |
| Figure 8‑13: Average Selling Price by Country, Total Non-Power-Injectable Implantable Port Market, Europe, 2019 – 2029 (€) |
260 |
| Figure 8‑14: Average Selling Price by Country, Total Non-Power-Injectable Implantable Port Market, Europe, 2019 – 2029 (US$) |
261 |
| Figure 8‑15: Market Value by Country, Total Non-Power-Injectable Implantable Port Market, Europe, 2019 – 2029 (€M) |
262 |
| Figure 8‑16: Market Value by Country, Total Non-Power-Injectable Implantable Port Market, Europe, 2019 – 2029 (US$M) |
263 |
| Figure 8‑17: Single-Lumen Non-Power-Injectable Implantable Port Market, Europe, 2019 – 2029 |
264 |
| Figure 8‑18: Units Sold by Country, Single-Lumen Non-Power-Injectable Implantable Port Market, Europe, 2019 – 2029 |
265 |
| Figure 8‑19: Average Selling Price by Country, Single-Lumen Non-Power-Injectable Implantable Port Market, Europe, 2019 – 2029 (€) |
266 |
| Figure 8‑20: Average Selling Price by Country, Single-Lumen Non-Power-Injectable Implantable Port Market, Europe, 2019 – 2029 (US$) |
267 |
| Figure 8‑21: Market Value by Country, Single-Lumen Non-Power-Injectable Implantable Port Market, Europe, 2019 – 2029 (€M) |
268 |
| Figure 8‑22: Market Value by Country, Single-Lumen Non-Power-Injectable Implantable Port Market, Europe, 2019 – 2029 (US$M) |
269 |
| Figure 8‑23: Double-Lumen Non-Power-Injectable Implantable Port Market, Europe, 2019 – 2029 |
270 |
| Figure 8‑24: Units Sold by Country, Double-Lumen Non-Power-Injectable Implantable Port Market, Europe, 2019 – 2029 |
271 |
| Figure 8‑25: Average Selling Price by Country, Double-Lumen Non-Power-Injectable Implantable Port Market, Europe, 2019 – 2029 (€) |
272 |
| Figure 8‑26: Average Selling Price by Country, Double-Lumen Non-Power-Injectable Implantable Port Market, Europe, 2019 – 2029 (US$) |
273 |
| Figure 8‑27: Market Value by Country, Double-Lumen Non-Power-Injectable Implantable Port Market, Europe, 2019 – 2029 (€M) |
274 |
| Figure 8‑28: Market Value by Country, Double-Lumen Non-Power-Injectable Implantable Port Market, Europe, 2019 – 2029 (US$M) |
275 |
| Figure 8‑29: Power-Injectable Implantable Port Market by Segment, Europe, 2019 – 2029 (€M) |
277 |
| Figure 8‑30: Power-Injectable Implantable Port Market by Segment, Europe, 2019 – 2029 (US$M) |
277 |
| Figure 8‑31: Total Power-Injectable Implantable Port Market, Europe, 2019 – 2029 |
278 |
| Figure 8‑32: Units Sold by Country, Total Power-Injectable Implantable Port Market, Europe, 2019 – 2029 |
279 |
| Figure 8‑33: Average Selling Price by Country, Total Power-Injectable Implantable Port Market, Europe, 2019 – 2029 (€) |
280 |
| Figure 8‑34: Average Selling Price by Country, Total Power-Injectable Implantable Port Market, Europe, 2019 – 2029 (US$) |
281 |
| Figure 8‑35: Market Value by Country, Total Power-Injectable Implantable Port Market, Europe, 2019 – 2029 (€M) |
282 |
| Figure 8‑36: Market Value by Country, Total Power-Injectable Implantable Port Market, Europe, 2019 – 2029 (US$M) |
283 |
| Figure 8‑37: Single-Lumen Power-Injectable Implantable Port Market, Europe, 2019 – 2029 |
284 |
| Figure 8‑38: Units Sold by Country, Single-Lumen Power-Injectable Implantable Port Market, Europe, 2019 – 2029 |
285 |
| Figure 8‑39: Average Selling Price by Country, Single-Lumen Power-Injectable Implantable Port Market, Europe, 2019 – 2029 (€) |
286 |
| Figure 8‑40: Average Selling Price by Country, Single-Lumen Power-Injectable Implantable Port Market, Europe, 2019 – 2029 (US$) |
287 |
| Figure 8‑41: Market Value by Country, Single-Lumen Power-Injectable Implantable Port Market, Europe, 2019 – 2029 (€M) |
288 |
| Figure 8‑42: Market Value by Country, Single-Lumen Power-Injectable Implantable Port Market, Europe, 2019 – 2029 (US$M) |
289 |
| Figure 8‑43: Double-Lumen Power-Injectable Implantable Port Market, Europe, 2019 – 2029 |
290 |
| Figure 8‑44: Units Sold by Country, Double-Lumen Power-Injectable Implantable Port Market, Europe, 2019 – 2029 |
291 |
| Figure 8‑45: Average Selling Price by Country, Double-Lumen Power-Injectable Implantable Port Market, Europe, 2019 – 2029 (€) |
292 |
| Figure 8‑46: Average Selling Price by Country, Double-Lumen Power-Injectable Implantable Port Market, Europe, 2019 – 2029 (US$) |
293 |
| Figure 8‑47: Market Value by Country, Double-Lumen Power-Injectable Implantable Port Market, Europe, 2019 – 2029 (€M) |
294 |
| Figure 8‑48: Market Value by Country, Double-Lumen Power-Injectable Implantable Port Market, Europe, 2019 – 2029 (US$M) |
295 |
| Figure 8‑49: Implantable Port Market by Device Property, Europe, 2019 – 2029 (€M) |
296 |
| Figure 8‑50: Implantable Port Market by Device Property, Europe, 2019 – 2029 (US$M) |
297 |
| Figure 8‑51: Antithrombogenic Implantable Port Market, Europe, 2019 – 2029 |
298 |
| Figure 8‑52: Units Sold by Country, Antithrombogenic Implantable Port Market, Europe, 2019 – 2029 |
299 |
| Figure 8‑53: Average Selling Price by Country, Antithrombogenic Implantable Port Market, Europe, 2019 – 2029 (€) |
300 |
| Figure 8‑54: Average Selling Price by Country, Antithrombogenic Implantable Port Market, Europe, 2019 – 2029 (US$) |
301 |
| Figure 8‑55: Market Value by Country, Antithrombogenic Implantable Port Market, Europe, 2019 – 2029 (€M) |
302 |
| Figure 8‑56: Market Value by Country, Antithrombogenic Implantable Port Market, Europe, 2019 – 2029 (US$M) |
303 |
| Figure 8‑57: Conventional Implantable Port Market, Europe, 2019 – 2029 |
304 |
| Figure 8‑58: Units Sold by Country, Conventional Implantable Port Market, Europe, 2019 – 2029 |
305 |
| Figure 8‑59: Average Selling Price by Country, Conventional Implantable Port Market, Europe, 2019 – 2029 (€) |
306 |
| Figure 8‑60: Average Selling Price by Country, Conventional Implantable Port Market, Europe, 2019 – 2029 (US$) |
307 |
| Figure 8‑61: Market Value by Country, Conventional Implantable Port Market, Europe, 2019 – 2029 (€M) |
308 |
| Figure 8‑62: Market Value by Country, Conventional Implantable Port Market, Europe, 2019 – 2029 (US$M) |
309 |
| Figure 8‑63: Leading Competitors by Country, Implantable Port Market, Europe, 2022 |
316 |
| Figure 9‑1: Port Needle Market by Segment, Europe, 2019 – 2029 (€M) |
320 |
| Figure 9‑2: Port Needle Market by Segment, Europe, 2019 – 2029 (US$M) |
321 |
| Figure 9‑3: Port Needle Market, Europe, 2019 – 2029 |
324 |
| Figure 9‑4: Units Sold by Country, Port Needle Market, Europe, 2019 – 2029 |
325 |
| Figure 9‑5: Average Selling Price by Country, Port Needle Market, Europe, 2019 – 2029 (€) |
326 |
| Figure 9‑6: Average Selling Price by Country, Port Needle Market, Europe, 2019 – 2029 (US$) |
327 |
| Figure 9‑7: Market Value by Country, Port Needle Market, Europe, 2019 – 2029 (€M) |
328 |
| Figure 9‑8: Market Value by Country, Port Needle Market, Europe, 2019 – 2029 (US$M) |
329 |
| Figure 9‑9: Conventional Port Needle Market, Europe, 2019 – 2029 |
331 |
| Figure 9‑10: Units Sold by Country, Conventional Port Needle Market, Europe, 2019 – 2029 |
332 |
| Figure 9‑11: Average Selling Price by Country, Conventional Port Needle Market, Europe, 2019 – 2029 (€) |
333 |
| Figure 9‑12: Average Selling Price by Country, Conventional Port Needle Market, Europe, 2019 – 2029 (US$) |
334 |
| Figure 9‑13: Market Value by Country, Conventional Port Needle Market, Europe, 2019 – 2029 (€M) |
335 |
| Figure 9‑14: Market Value by Country, Conventional Port Needle Market, Europe, 2019 – 2029 (US$M) |
336 |
| Figure 9‑15: Safety Port Needle Market by Segment, Europe, 2019 – 2029 (€M) |
338 |
| Figure 9‑16: Safety Port Needle Market by Segment, Europe, 2019 – 2029 (US$M) |
338 |
| Figure 9‑17: Total Safety Port Needle Market, Europe, 2019 – 2029 |
339 |
| Figure 9‑18: Units Sold by Country, Total Safety Port Needle Market, Europe, 2019 – 2029 |
340 |
| Figure 9‑19: Average Selling Price by Country, Total Safety Port Needle Market, Europe, 2019 – 2029 (€) |
341 |
| Figure 9‑20: Average Selling Price by Country, Total Safety Port Needle Market, Europe, 2019 – 2029 (US$) |
342 |
| Figure 9‑21: Market Value by Country, Total Safety Port Needle Market, Europe, 2019 – 2029 (€M) |
343 |
| Figure 9‑22: Market Value by Country, Total Safety Port Needle Market, Europe, 2019 – 2029 (US$M) |
344 |
| Figure 9‑23: Power-Injectable Safety Port Needle Market, Europe, 2019 – 2029 |
346 |
| Figure 9‑24: Units Sold by Country, Power-Injectable Safety Port Needle Market, Europe, 2019 – 2029 |
347 |
| Figure 9‑25: Average Selling Price by Country, Power-Injectable Safety Port Needle Market, Europe, 2019 – 2029 (€) |
348 |
| Figure 9‑26: Average Selling Price by Country, Power-Injectable Safety Port Needle Market, Europe, 2019 – 2029 (US$) |
349 |
| Figure 9‑27: Market Value by Country, Power-Injectable Safety Port Needle Market, Europe, 2019 – 2029 (€M) |
350 |
| Figure 9‑28: Market Value by Country, Power-Injectable Safety Port Needle Market, Europe, 2019 – 2029 (US$M) |
351 |
| Figure 9‑29: Non-Power-Injectable Safety Port Needle Market, Europe, 2019 – 2029 |
352 |
| Figure 9‑30: Units Sold by Country, Non-Power-Injectable Safety Port Needle Market, Europe, 2019 – 2029 |
353 |
| Figure 9‑31: Average Selling Price by Country, Non-Power-Injectable Safety Port Needle Market, Europe, 2019 – 2029 (€) |
354 |
| Figure 9‑32: Average Selling Price by Country, Non-Power-Injectable Safety Port Needle Market, Europe, 2019 – 2029 (US$) |
355 |
| Figure 9‑33: Market Value by Country, Non-Power-Injectable Safety Port Needle Market, Europe, 2019 – 2029 (€M) |
356 |
| Figure 9‑34: Market Value by Country, Non-Power-Injectable Safety Port Needle Market, Europe, 2019 – 2029 (US$M) |
357 |
| Figure 9‑35: Leading Competitors by Country, Port Needle Market, Europe, 2022 |
363 |
| Figure 10‑1: Central Venous Catheter Market by Segment, Europe, 2019 – 2029 (€M) |
367 |
| Figure 10‑2: Central Venous Catheter Market by Segment, Europe, 2019 – 2029 (US$M) |
367 |
| Figure 10‑3: Total Central Venous Catheter Market, Europe, 2019 – 2029 |
370 |
| Figure 10‑4: Units Sold by Country, Central Venous Catheter Market, Europe, 2019 – 2029 |
371 |
| Figure 10‑5: Average Selling Price by Country, Central Venous Catheter Market, Europe, 2019 – 2029 (€) |
372 |
| Figure 10‑6: Average Selling Price by Country, Central Venous Catheter Market, Europe, 2019 – 2029 (US$) |
373 |
| Figure 10‑7: Market Value by Country, Central Venous Catheter Market, Europe, 2019 – 2029 (€M) |
374 |
| Figure 10‑8: Market Value by Country, Central Venous Catheter Market, Europe, 2019 – 2029 (US$M) |
375 |
| Figure 10‑9: Total Acute Central Venous Catheter Market, Europe, 2019 – 2029 |
376 |
| Figure 10‑10: Units Sold by Country, Total Acute Central Venous Catheter Market, Europe, 2019 – 2029 |
377 |
| Figure 10‑11: Average Selling Price by Country, Total Acute Central Venous Catheter Market, Europe, 2019 – 2029 (€) |
378 |
| Figure 10‑12: Average Selling Price by Country, Total Acute Central Venous Catheter Market, Europe, 2019 – 2029 (US$) |
379 |
| Figure 10‑13: Market Value by Country, Total Acute Central Venous Catheter Market, Europe, 2019 – 2029 (€M) |
380 |
| Figure 10‑14: Market Value by Country, Total Acute Central Venous Catheter Market, Europe, 2019 – 2029 (US$M) |
381 |
| Figure 10‑15: Acute Central Venous Catheter Market by Device Type, Europe, 2019 – 2029 (€M) |
383 |
| Figure 10‑16: Acute Central Venous Catheter Market by Device Type, Europe, 2019 – 2029 (US$M) |
383 |
| Figure 10‑17: Conventional Acute Central Venous Catheter Market, Europe, 2019 – 2029 |
385 |
| Figure 10‑18: Units Sold by Country, Conventional Acute Central Venous Catheter Market, Europe, 2019 – 2029 |
386 |
| Figure 10‑19: Average Selling Price by Country, Conventional Acute Central Venous Catheter Market, Europe, 2019 – 2029 (€) |
387 |
| Figure 10‑20: Average Selling Price by Country, Conventional Acute Central Venous Catheter Market, Europe, 2019 – 2029 (US$) |
388 |
| Figure 10‑21: Market Value by Country, Conventional Acute Central Venous Catheter Market, Europe, 2019 – 2029 (€M) |
389 |
| Figure 10‑22: Market Value by Country, Conventional Acute Central Venous Catheter Market, Europe, 2019 – 2029 (US$M) |
390 |
| Figure 10‑23: Antimicrobial Acute Central Venous Catheter Market, Europe, 2019 – 2029 |
392 |
| Figure 10‑24: Units Sold by Country, Antimicrobial Acute Central Venous Catheter Market, Europe, 2019 – 2029 |
393 |
| Figure 10‑25: Average Selling Price by Country, Antimicrobial Acute Central Venous Catheter Market, Europe, 2019 – 2029 (€) |
394 |
| Figure 10‑26: Average Selling Price by Country, Antimicrobial Acute Central Venous Catheter Market, Europe, 2019 – 2029 (US$) |
395 |
| Figure 10‑27: Market Value by Country, Antimicrobial Acute Central Venous Catheter Market, Europe, 2019 – 2029 (€M) |
396 |
| Figure 10‑28: Market Value by Country, Antimicrobial Acute Central Venous Catheter Market, Europe, 2019 – 2029 (US$M) |
397 |
| Figure 10‑29: Acute Central Venous Catheter Market by Injectability, Europe, 2019 – 2029 (€M) |
399 |
| Figure 10‑30: Acute Central Venous Catheter Market by Injectability, Europe, 2019 – 2029 (US$M) |
399 |
| Figure 10‑31: Power-Injectable Acute Central Venous Catheter Market, Europe, 2019 – 2029 |
400 |
| Figure 10‑32: Units Sold by Country, Power-Injectable Acute Central Venous Catheter Market, Europe, 2019 – 2029 |
401 |
| Figure 10‑33: Average Selling Price by Country, Power-Injectable Acute Central Venous Catheter Market, Europe, 2019 – 2029 (€) |
402 |
| Figure 10‑34: Average Selling Price by Country, Power-Injectable Acute Central Venous Catheter Market, Europe, 2019 – 2029 (US$) |
403 |
| Figure 10‑35: Market Value by Country, Power-Injectable Acute Central Venous Catheter Market, Europe, 2019 – 2029 (€M) |
404 |
| Figure 10‑36: Market Value by Country, Power-Injectable Acute Central Venous Catheter Market, Europe, 2019 – 2029 (US$M) |
405 |
| Figure 10‑37: Non-Power-Injectable Acute Central Venous Catheter Market, Europe, 2019 – 2029 |
406 |
| Figure 10‑38: Units Sold by Country, Non-Power-Injectable Acute Central Venous Catheter Market, Europe, 2019 – 2029 |
407 |
| Figure 10‑39: Average Selling Price by Country, Non-Power-Injectable Acute Central Venous Catheter Market, Europe, 2019 – 2029 (€) |
408 |
| Figure 10‑40: Average Selling Price by Country, Non-Power-Injectable Acute Central Venous Catheter Market, Europe, 2019 – 2029 (US$) |
409 |
| Figure 10‑41: Market Value by Country, Non-Power-Injectable Acute Central Venous Catheter Market, Europe, 2019 – 2029 (€M) |
410 |
| Figure 10‑42: Market Value by Country, Non-Power-Injectable Acute Central Venous Catheter Market, Europe, 2019 – 2029 (US$M) |
411 |
| Figure 10‑43: Total Chronic Central Venous Catheter Market, Europe, 2019 – 2029 |
413 |
| Figure 10‑44: Units Sold by Country, Total Chronic Central Venous Catheter Market, Europe, 2019 – 2029 |
414 |
| Figure 10‑45: Average Selling Price by Country, Total Chronic Central Venous Catheter Market, Europe, 2019 – 2029 (€) |
415 |
| Figure 10‑46: Average Selling Price by Country, Total Chronic Central Venous Catheter Market, Europe, 2019 – 2029 (US$) |
416 |
| Figure 10‑47: Market Value by Country, Total Chronic Central Venous Catheter Market, Europe, 2019 – 2029 (€M) |
417 |
| Figure 10‑48: Market Value by Country, Total Chronic Central Venous Catheter Market, Europe, 2019 – 2029 (US$M) |
418 |
| Figure 10‑49: Chronic Central Venous Catheter Market by Injectability, Europe, 2019 – 2029 (€M) |
419 |
| Figure 10‑50: Chronic Central Venous Catheter Market by Injectability, Europe, 2019 – 2029 (US$M) |
420 |
| Figure 10‑51: Power-Injectable Chronic Central Venous Catheter Market, Europe, 2019 – 2029 |
421 |
| Figure 10‑52: Units Sold by Country, Power-Injectable Chronic Central Venous Catheter Market, Europe, 2019 – 2029 |
422 |
| Figure 10‑53: Average Selling Price by Country, Power-Injectable Chronic Central Venous Catheter Market, Europe, 2019 – 2029 (€) |
423 |
| Figure 10‑54: Average Selling Price by Country, Power-Injectable Chronic Central Venous Catheter Market, Europe, 2019 – 2029 (US$) |
424 |
| Figure 10‑55: Market Value by Country, Power-Injectable Chronic Central Venous Catheter Market, Europe, 2019 – 2029 (€M) |
425 |
| Figure 10‑56: Market Value by Country, Power-Injectable Chronic Central Venous Catheter Market, Europe, 2019 – 2029 (US$M) |
426 |
| Figure 10‑57: Non-Power-Injectable Chronic Central Venous Catheter Market, Europe, 2019 – 2029 |
427 |
| Figure 10‑58: Units Sold by Country, Non-Power-Injectable Chronic Central Venous Catheter Market, Europe, 2019 – 2029 |
428 |
| Figure 10‑59: Average Selling Price by Country, Non-Power-Injectable Chronic Central Venous Catheter Market, Europe, 2019 – 2029 (€) |
429 |
| Figure 10‑60: Average Selling Price by Country, Non-Power-Injectable Chronic Central Venous Catheter Market, Europe, 2019 – 2029 (US$) |
430 |
| Figure 10‑61: Market Value by Country, Non-Power-Injectable Chronic Central Venous Catheter Market, Europe, 2019 – 2029 (€M) |
431 |
| Figure 10‑62: Market Value by Country, Non-Power-Injectable Chronic Central Venous Catheter Market, Europe, 2019 – 2029 (US$M) |
432 |
| Figure 10‑63: Chronic Central Venous Catheter Market by Device Type, Europe, 2019 – 2029 (€M) |
433 |
| Figure 10‑64: Chronic Central Venous Catheter Market by Device Type, Europe, 2019 – 2029 (US$M) |
434 |
| Figure 10‑65: Advanced Material Chronic Central Venous Catheter Market, Europe, 2019 – 2029 |
435 |
| Figure 10‑66: Units Sold by Country, Advanced Material Chronic Central Venous Catheter Market, Europe, 2019 – 2029 |
436 |
| Figure 10‑67: Average Selling Price by Country, Advanced Material Chronic Central Venous Catheter Market, Europe, 2019 – 2029 (€) |
437 |
| Figure 10‑68: Average Selling Price by Country, Advanced Material Chronic Central Venous Catheter Market, Europe, 2019 – 2029 (US$) |
438 |
| Figure 10‑69: Market Value by Country, Advanced Material Chronic Central Venous Catheter Market, Europe, 2019 – 2029 (€M) |
439 |
| Figure 10‑70: Market Value by Country, Advanced Material Chronic Central Venous Catheter Market, Europe, 2019 – 2029 (US$M) |
440 |
| Figure 10‑71: Conventional Chronic Central Venous Catheter Market, Europe, 2019 – 2029 |
441 |
| Figure 10‑72: Units Sold by Country, Conventional Chronic Central Venous Catheter Market, Europe, 2019 – 2029 |
442 |
| Figure 10‑73: Average Selling Price by Country, Conventional Chronic Central Venous Catheter Market, Europe, 2019 – 2029 (€) |
443 |
| Figure 10‑74: Average Selling Price by Country, Conventional Chronic Central Venous Catheter Market, Europe, 2019 – 2029 (US$) |
444 |
| Figure 10‑75: Market Value by Country, Conventional Chronic Central Venous Catheter Market, Europe, 2019 – 2029 (€M) |
445 |
| Figure 10‑76: Market Value by Country, Conventional Chronic Central Venous Catheter Market, Europe, 2019 – 2029 (US$M) |
446 |
| Figure 10‑77: Leading Competitors, Central Venous Catheter Market, Europe, 2022 |
453 |
| Figure 10‑78: Leading Competitors by Country, Central Venous Catheter Market, Europe, 2022 |
454 |
| Figure 11‑1: Peripherally Inserted Central Catheter Market by Segment, Europe, 2019 – 2029 (€M) |
458 |
| Figure 11‑2: Peripherally Inserted Central Catheter Market by Segment, Europe, 2019 – 2029 (US$M) |
459 |
| Figure 11‑3: Total Peripherally Inserted Central Catheter Market, Europe, 2019 – 2029 |
463 |
| Figure 11‑4: Units Sold by Country, Peripherally Inserted Central Catheter Market, Europe, 2019 – 2029 |
464 |
| Figure 11‑5: Average Selling Price by Country, Peripherally Inserted Central Catheter Market, Europe, 2019 – 2029 (€) |
465 |
| Figure 11‑6: Average Selling Price by Country, Peripherally Inserted Central Catheter Market, Europe, 2019 – 2029 (US$) |
466 |
| Figure 11‑7: Market Value by Country, Peripherally Inserted Central Catheter Market, Europe, 2019 – 2029 (€M) |
467 |
| Figure 11‑8: Market Value by Country, Peripherally Inserted Central Catheter Market, Europe, 2019 – 2029 (US$M) |
468 |
| Figure 11‑9: Single-Lumen Peripherally Inserted Central Catheter Market, Europe, 2019 – 2029 |
470 |
| Figure 11‑10: Units Sold by Country, Single-Lumen Peripherally Inserted Central Catheter Market, Europe, 2019 – 2029 |
471 |
| Figure 11‑11: Average Selling Price by Country, Single-Lumen Peripherally Inserted Central Catheter Market, Europe, 2019 – 2029 (€) |
472 |
| Figure 11‑12: Average Selling Price by Country, Single-Lumen Peripherally Inserted Central Catheter Market, Europe, 2019 – 2029 (US$) |
473 |
| Figure 11‑13: Market Value by Country, Single-Lumen Peripherally Inserted Central Catheter Market, Europe, 2019 – 2029 (€M) |
474 |
| Figure 11‑14: Market Value by Country, Single-Lumen Peripherally Inserted Central Catheter Market, Europe, 2019 – 2029 (US$M) |
475 |
| Figure 11‑15: Double-Lumen Peripherally Inserted Central Catheter Market, Europe, 2019 – 2029 |
476 |
| Figure 11‑16: Units Sold by Country, Double-Lumen Peripherally Inserted Central Catheter Market, Europe, 2019 – 2029 |
477 |
| Figure 11‑17: Average Selling Price by Country, Double-Lumen Peripherally Inserted Central Catheter Market, Europe, 2019 – 2029 (€) |
478 |
| Figure 11‑18: Average Selling Price by Country, Double-Lumen Peripherally Inserted Central Catheter Market, Europe, 2019 – 2029 (US$) |
479 |
| Figure 11‑19: Market Value by Country, Double-Lumen Peripherally Inserted Central Catheter Market, Europe, 2019 – 2029 (€M) |
480 |
| Figure 11‑20: Market Value by Country, Double-Lumen Peripherally Inserted Central Catheter Market, Europe, 2019 – 2029 (US$M) |
481 |
| Figure 11‑21: Triple-Lumen Peripherally Inserted Central Catheter Market, Europe, 2019 – 2029 |
482 |
| Figure 11‑22: Units Sold by Country, Triple-Lumen Peripherally Inserted Central Catheter Market, Europe, 2019 – 2029 |
483 |
| Figure 11‑23: Average Selling Price by Country, Triple-Lumen Peripherally Inserted Central Catheter Market, Europe, 2019 – 2029 (€) |
484 |
| Figure 11‑24: Average Selling Price by Country, Triple-Lumen Peripherally Inserted Central Catheter Market, Europe, 2019 – 2029 (US$) |
485 |
| Figure 11‑25: Market Value by Country, Triple-Lumen Peripherally Inserted Central Catheter Market, Europe, 2019 – 2029 (€M) |
486 |
| Figure 11‑26: Market Value by Country, Triple-Lumen Peripherally Inserted Central Catheter Market, Europe, 2019 – 2029 (US$M) |
487 |
| Figure 11‑27: Peripherally Inserted Central Catheter Market by Segment, Europe, 2019 – 2029 (€M) |
488 |
| Figure 11‑28: Peripherally Inserted Central Catheter Market by Segment, Europe, 2019 – 2029 (US$M) |
489 |
| Figure 11‑29: Non-Power-Injectable Peripherally Inserted Central Catheter Market, Europe, 2019 – 2029 |
491 |
| Figure 11‑30: Units Sold by Country, Non-Power-Injectable Peripherally Inserted Central Catheter Market, Europe, 2019 – 2029 |
492 |
| Figure 11‑31: Average Selling Price by Country, Non-Power-Injectable Peripherally Inserted Central Catheter Market, Europe, 2019 – 2029 (€) |
493 |
| Figure 11‑32: Average Selling Price by Country, Non-Power-Injectable Peripherally Inserted Central Catheter Market, Europe, 2019 – 2029 (US$) |
494 |
| Figure 11‑33: Market Value by Country, Non-Power-Injectable Peripherally Inserted Central Catheter Market, Europe, 2019 – 2029 (€M) |
495 |
| Figure 11‑34: Market Value by Country, Non-Power-Injectable Peripherally Inserted Central Catheter Market, Europe, 2019 – 2029 (US$M) |
496 |
| Figure 11‑35: Power-Injectable Peripherally Inserted Central Catheter Market by Segment, Europe, 2019 – 2029 (€M) |
498 |
| Figure 11‑36: Power-Injectable Peripherally Inserted Central Catheter Market by Segment, Europe, 2019 – 2029 (US$M) |
499 |
| Figure 11‑37: Total Power-Injectable Peripherally Inserted Central Catheter Market, Europe, 2019 – 2029 |
499 |
| Figure 11‑38: Units Sold by Country, Total Power-Injectable Peripherally Inserted Central Catheter Market, Europe, 2019 – 2029 |
500 |
| Figure 11‑39: Average Selling Price by Country, Total Power-Injectable Peripherally Inserted Central Catheter Market, Europe, 2019 – 2029 (€) |
501 |
| Figure 11‑40: Average Selling Price by Country, Total Power-Injectable Peripherally Inserted Central Catheter Market, Europe, 2019 – 2029 (US$) |
502 |
| Figure 11‑41: Market Value by Country, Total Power-Injectable Peripherally Inserted Central Catheter Market, Europe, 2019 – 2029 (€M) |
503 |
| Figure 11‑42: Market Value by Country, Total Power-Injectable Peripherally Inserted Central Catheter Market, Europe, 2019 – 2029 (US$M) |
504 |
| Figure 11‑43: Advanced Material Power-Injectable Peripherally Inserted Central Catheter Market, Europe, 2019 – 2029 |
505 |
| Figure 11‑44: Units Sold by Country, Advanced Material Power-Injectable Peripherally Inserted Central Catheter Market, Europe, 2019 – 2029 |
506 |
| Figure 11‑45: Average Selling Price by Country, Advanced Material Power-Injectable Peripherally Inserted Central Catheter Market, Europe, 2019 – 2029 (€) |
507 |
| Figure 11‑46: Average Selling Price by Country, Advanced Material Power-Injectable Peripherally Inserted Central Catheter Market, Europe, 2019 – 2029 (US$) |
508 |
| Figure 11‑47: Market Value by Country, Advanced Material Power-Injectable Peripherally Inserted Central Catheter Market, Europe, 2019 – 2029 (€M) |
509 |
| Figure 11‑48: Market Value by Country, Advanced Material Power-Injectable Peripherally Inserted Central Catheter Market, Europe, 2019 – 2029 (US$M) |
510 |
| Figure 11‑49: Conventional Power-Injectable Peripherally Inserted Central Catheter Market, Europe, 2019 – 2029 |
511 |
| Figure 11‑50: Units Sold by Country, Conventional Power-Injectable Peripherally Inserted Central Catheter Market, Europe, 2019 – 2029 |
512 |
| Figure 11‑51: Average Selling Price by Country, Conventional Power-Injectable Peripherally Inserted Central Catheter Market, Europe, 2019 – 2029 (€) |
513 |
| Figure 11‑52: Average Selling Price by Country, Conventional Power-Injectable Peripherally Inserted Central Catheter Market, Europe, 2019 – 2029 (US$) |
514 |
| Figure 11‑53: Market Value by Country, Conventional Power-Injectable Peripherally Inserted Central Catheter Market, Europe, 2019 – 2029 (€M) |
515 |
| Figure 11‑54: Market Value by Country, Conventional Power-Injectable Peripherally Inserted Central Catheter Market, Europe, 2019 – 2029 (US$M) |
516 |
| Figure 11‑55: Peripherally Inserted Central Catheter Market by Kit Type, Europe, 2019 – 2029 (€M) |
517 |
| Figure 11‑56: Peripherally Inserted Central Catheter Market by Kit Type, Europe, 2019 – 2029 (US$M) |
518 |
| Figure 11‑57: Tip-Placement Kit Peripherally Inserted Central Catheter Market, Europe, 2019 – 2029 |
519 |
| Figure 11‑58: Units Sold by Country, Tip-Placement Kit Peripherally Inserted Central Catheter Market, Europe, 2019 – 2029 |
520 |
| Figure 11‑59: Average Selling Price by Country, Tip-Placement Kit Peripherally Inserted Central Catheter Market, Europe, 2019 – 2029 (€) |
521 |
| Figure 11‑60: Average Selling Price by Country, Tip-Placement Kit Peripherally Inserted Central Catheter Market, Europe, 2019 – 2029 (US$) |
522 |
| Figure 11‑61: Market Value by Country, Tip-Placement Kit Peripherally Inserted Central Catheter Market, Europe, 2019 – 2029 (€M) |
523 |
| Figure 11‑62: Market Value by Country, Tip-Placement Kit Peripherally Inserted Central Catheter Market, Europe, 2019 – 2029 (US$M) |
524 |
| Figure 11‑63: Conventional Kit Peripherally Inserted Central Catheter Market, Europe, 2019 – 2029 |
525 |
| Figure 11‑64: Units Sold by Country, Conventional Kit Peripherally Inserted Central Catheter Market, Europe, 2019 – 2029 |
526 |
| Figure 11‑65: Average Selling Price by Country, Conventional Kit Peripherally Inserted Central Catheter Market, Europe, 2019 – 2029 (€) |
527 |
| Figure 11‑66: Average Selling Price by Country, Conventional Kit Peripherally Inserted Central Catheter Market, Europe, 2019 – 2029 (US$) |
528 |
| Figure 11‑67: Market Value by Country, Conventional Kit Peripherally Inserted Central Catheter Market, Europe, 2019 – 2029 (€M) |
529 |
| Figure 11‑68: Market Value by Country, Conventional Kit Peripherally Inserted Central Catheter Market, Europe, 2019 – 2029 (US$M) |
530 |
| Figure 11‑69: Leading Competitors by Country, Peripherally Inserted Central Catheter Market, Europe, 2022 |
536 |
| Figure 12‑1: Peripheral Intravenous Catheter Market by Segment, Europe, 2019 – 2029 (€M) |
541 |
| Figure 12‑2: Peripheral Intravenous Catheter Market by Segment, Europe, 2019 – 2029 (US$M) |
542 |
| Figure 12‑3: Total Peripheral Intravenous Catheter Market, Europe, 2019 – 2029 |
545 |
| Figure 12‑4: Units Sold by Country, Peripheral Intravenous Catheter Market, Europe, 2019 – 2029 (1 of 2) |
546 |
| Figure 12‑5: Units Sold by Country, Peripheral Intravenous Catheter Market, Europe, 2019 – 2029 (2 of 2) |
546 |
| Figure 12‑6: Average Selling Price by Country, Peripheral Intravenous Catheter Market, Europe, 2019 – 2029 (€) |
547 |
| Figure 12‑7: Average Selling Price by Country, Peripheral Intravenous Catheter Market, Europe, 2019 – 2029 (US$) |
548 |
| Figure 12‑8: Market Value by Country, Peripheral Intravenous Catheter Market, Europe, 2019 – 2029 (€M) |
549 |
| Figure 12‑9: Market Value by Country, Peripheral Intravenous Catheter Market, Europe, 2019 – 2029 (US$M) |
550 |
| Figure 12‑10: Conventional Peripheral Intravenous Catheter Market, Europe, 2019 – 2029 |
552 |
| Figure 12‑11: Units Sold by Country, Conventional Peripheral Intravenous Catheter Market, Europe, 2019 – 2029 (1 of 2) |
553 |
| Figure 12‑12: Units Sold by Country, Conventional Peripheral Intravenous Catheter Market, Europe, 2019 – 2029 (2 of 2) |
553 |
| Figure 12‑13: Average Selling Price by Country, Conventional Peripheral Intravenous Catheter Market, Europe, 2019 – 2029 (€) |
554 |
| Figure 12‑14: Average Selling Price by Country, Conventional Peripheral Intravenous Catheter Market, Europe, 2019 – 2029 (US$) |
555 |
| Figure 12‑15: Market Value by Country, Conventional Peripheral Intravenous Catheter Market, Europe, 2019 – 2029 (€M) |
556 |
| Figure 12‑16: Market Value by Country, Conventional Peripheral Intravenous Catheter Market, Europe, 2019 – 2029 (US$M) |
557 |
| Figure 12‑17: Safety Peripheral Intravenous Catheter Market by Segment, Europe, 2019 – 2029 (€M) |
559 |
| Figure 12‑18: Safety Peripheral Intravenous Catheter Market by Segment, Europe, 2019 – 2029 (US$M) |
560 |
| Figure 12‑19: Safety Peripheral Intravenous Catheter Market, Europe, 2019 – 2029 |
561 |
| Figure 12‑20: Units Sold by Country, Safety Peripheral Intravenous Catheter Market, Europe, 2019 – 2029 (1 of 2) |
562 |
| Figure 12‑21: Units Sold by Country, Safety Peripheral Intravenous Catheter Market, Europe, 2019 – 2029 (2 of 2) |
562 |
| Figure 12‑22: Average Selling Price by Country, Safety Peripheral Intravenous Catheter Market, Europe, 2019 – 2029 (€) |
563 |
| Figure 12‑23: Average Selling Price by Country, Safety Peripheral Intravenous Catheter Market, Europe, 2019 – 2029 (US$) |
564 |
| Figure 12‑24: Market Value by Country, Safety Peripheral Intravenous Catheter Market, Europe, 2019 – 2029 (€M) |
565 |
| Figure 12‑25: Market Value by Country, Safety Peripheral Intravenous Catheter Market, Europe, 2019 – 2029 (US$M) |
566 |
| Figure 12‑26: Blood Control Safety Peripheral Intravenous Catheter Market by Segment, Europe, 2019 – 2029 (€M) |
567 |
| Figure 12‑27: Blood Control Safety Peripheral Intravenous Catheter Market by Segment, Europe, 2019 – 2029 (US$M) |
568 |
| Figure 12‑28: Total Blood Control Safety Peripheral Intravenous Catheter Market, Europe, 2019 – 2029 |
568 |
| Figure 12‑29: Units Sold by Country, Total Blood Control Safety Peripheral Intravenous Catheter Market, Europe, 2019 – 2029 (1 of 2) |
569 |
| Figure 12‑30: Units Sold by Country, Total Blood Control Safety Peripheral Intravenous Catheter Market, Europe, 2019 – 2029 (2 of 2) |
569 |
| Figure 12‑31: Average Selling Price by Country, Total Blood Control Safety Peripheral Intravenous Catheter Market, Europe, 2019 – 2029 (€) |
570 |
| Figure 12‑32: Average Selling Price by Country, Total Blood Control Safety Peripheral Intravenous Catheter Market, Europe, 2019 – 2029 (US$) |
571 |
| Figure 12‑33: Market Value by Country, Total Blood Control Safety Peripheral Intravenous Catheter Market, Europe, 2019 – 2029 (€M) |
572 |
| Figure 12‑34: Market Value by Country, Total Blood Control Safety Peripheral Intravenous Catheter Market, Europe, 2019 – 2029 (US$M) |
573 |
| Figure 12‑35: Integrated Blood Control Safety Peripheral Intravenous Catheter Market, Europe, 2019 – 2029 |
574 |
| Figure 12‑36: Units Sold by Country, Integrated Blood Control Safety Peripheral Intravenous Catheter Market, Europe, 2019 – 2029 |
575 |
| Figure 12‑37: Average Selling Price by Country, Integrated Blood Control Safety Peripheral Intravenous Catheter Market, Europe, 2019 – 2029 (€) |
576 |
| Figure 12‑38: Average Selling Price by Country, Integrated Blood Control Safety Peripheral Intravenous Catheter Market, Europe, 2019 – 2029 (US$) |
577 |
| Figure 12‑39: Market Value by Country, Integrated Blood Control Safety Peripheral Intravenous Catheter Market, Europe, 2019 – 2029 (€M) |
578 |
| Figure 12‑40: Market Value by Country, Integrated Blood Control Safety Peripheral Intravenous Catheter Market, Europe, 2019 – 2029 (US$M) |
579 |
| Figure 12‑41: Non-Integrated Blood Control Safety Peripheral Intravenous Catheter Market, Europe, 2019 – 2029 |
580 |
| Figure 12‑42: Units Sold by Country, Non-Integrated Blood Control Safety Peripheral Intravenous Catheter Market, Europe, 2019 – 2029 (1 of 2) |
581 |
| Figure 12‑43: Units Sold by Country, Non-Integrated Blood Control Safety Peripheral Intravenous Catheter Market, Europe, 2019 – 2029 (2 of 2) |
581 |
| Figure 12‑44: Average Selling Price by Country, Non-Integrated Blood Control Safety Peripheral Intravenous Catheter Market, Europe, 2019 – 2029 (€) |
582 |
| Figure 12‑45: Average Selling Price by Country, Non-Integrated Blood Control Safety Peripheral Intravenous Catheter Market, Europe, 2019 – 2029 (US$) |
583 |
| Figure 12‑46: Market Value by Country, Non-Integrated Blood Control Safety Peripheral Intravenous Catheter Market, Europe, 2019 – 2029 (€M) |
584 |
| Figure 12‑47: Market Value by Country, Non-Integrated Blood Control Safety Peripheral Intravenous Catheter Market, Europe, 2019 – 2029 (US$M) |
585 |
| Figure 12‑48: Non-Blood Control Safety Peripheral Intravenous Catheter Market by Segment, Europe, 2019 – 2029 (€M) |
587 |
| Figure 12‑49: Non-Blood Control Safety Peripheral Intravenous Catheter Market by Segment, Europe, 2019 – 2029 (US$M) |
588 |
| Figure 12‑50: Total Non-Blood Control Safety Peripheral Intravenous Catheter Market, Europe, 2019 – 2029 |
588 |
| Figure 12‑51: Units Sold by Country, Total Non-Blood Control Safety Peripheral Intravenous Catheter Market, Europe, 2019 – 2029 (1 of 2) |
589 |
| Figure 12‑52: Units Sold by Country, Total Non-Blood Control Safety Peripheral Intravenous Catheter Market, Europe, 2019 – 2029 (2 of 2) |
589 |
| Figure 12‑53: Average Selling Price by Country, Total Non-Blood Control Safety Peripheral Intravenous Catheter Market, Europe, 2019 – 2029 (€) |
590 |
| Figure 12‑54: Average Selling Price by Country, Total Non-Blood Control Safety Peripheral Intravenous Catheter Market, Europe, 2019 – 2029 (US$) |
591 |
| Figure 12‑55: Market Value by Country, Total Non-Blood Control Safety Peripheral Intravenous Catheter Market, Europe, 2019 – 2029 (€M) |
592 |
| Figure 12‑56: Market Value by Country, Total Non-Blood Control Safety Peripheral Intravenous Catheter Market, Europe, 2019 – 2029 (US$M) |
593 |
| Figure 12‑57: Active Non-Blood Control Safety Peripheral Intravenous Catheter Market, Europe, 2019 – 2029 |
594 |
| Figure 12‑58: Units Sold by Country, Active Non-Blood Control Safety Peripheral Intravenous Catheter Market, Europe, 2019 – 2029 (1 of 2) |
595 |
| Figure 12‑59: Units Sold by Country, Active Non-Blood Control Safety Peripheral Intravenous Catheter Market, Europe, 2019 – 2029 (2 of 2) |
595 |
| Figure 12‑60: Average Selling Price by Country, Active Non-Blood Control Safety Peripheral Intravenous Catheter Market, Europe, 2019 – 2029 (€) |
596 |
| Figure 12‑61: Average Selling Price by Country, Active Non-Blood Control Safety Peripheral Intravenous Catheter Market, Europe, 2019 – 2029 (US$) |
597 |
| Figure 12‑62: Market Value by Country, Active Non-Blood Control Safety Peripheral Intravenous Catheter Market, Europe, 2019 – 2029 (€M) |
598 |
| Figure 12‑63: Market Value by Country, Active Non-Blood Control Safety Peripheral Intravenous Catheter Market, Europe, 2019 – 2029 (US$M) |
599 |
| Figure 12‑64: Passive Non-Blood Control Safety Peripheral Intravenous Catheter Market, Europe, 2019 – 2029 |
600 |
| Figure 12‑65: Units Sold by Country, Passive Non-Blood Control Safety Peripheral Intravenous Catheter Market, Europe, 2019 – 2029 (1 of 2) |
601 |
| Figure 12‑66: Units Sold by Country, Passive Non-Blood Control Safety Peripheral Intravenous Catheter Market, Europe, 2019 – 2029 (2 of 2) |
601 |
| Figure 12‑67: Average Selling Price by Country, Passive Non-Blood Control Safety Peripheral Intravenous Catheter Market, Europe, 2019 – 2029 (€) |
602 |
| Figure 12‑68: Average Selling Price by Country, Passive Non-Blood Control Safety Peripheral Intravenous Catheter Market, Europe, 2019 – 2029 (US$) |
603 |
| Figure 12‑69: Market Value by Country, Passive Non-Blood Control Safety Peripheral Intravenous Catheter Market, Europe, 2019 – 2029 (€M) |
604 |
| Figure 12‑70: Market Value by Country, Passive Non-Blood Control Safety Peripheral Intravenous Catheter Market, Europe, 2019 – 2029 (US$M) |
605 |
| Figure 12‑71: Peripheral Intravenous Catheter Market by Setting, Europe, 2019 – 2029 (€M) |
607 |
| Figure 12‑72: Peripheral Intravenous Catheter Market by Setting, Europe, 2019 – 2029 (US$M) |
607 |
| Figure 12‑73: Acute Care Peripheral Intravenous Catheter Market, Europe, 2019 – 2029 |
608 |
| Figure 12‑74: Units Sold by Country, Acute Care Peripheral Intravenous Catheter Market, Europe, 2019 – 2029 (1 of 2) |
609 |
| Figure 12‑75: Units Sold by Country, Acute Care Peripheral Intravenous Catheter Market, Europe, 2019 – 2029 (2 of 2) |
609 |
| Figure 12‑76: Average Selling Price by Country, Acute Care Peripheral Intravenous Catheter Market, Europe, 2019 – 2029 (€) |
610 |
| Figure 12‑77: Average Selling Price by Country, Acute Care Peripheral Intravenous Catheter Market, Europe, 2019 – 2029 (US$) |
611 |
| Figure 12‑78: Market Value by Country, Acute Care Peripheral Intravenous Catheter Market, Europe, 2019 – 2029 (€M) |
612 |
| Figure 12‑79: Market Value by Country, Acute Care Peripheral Intravenous Catheter Market, Europe, 2019 – 2029 (US$M) |
613 |
| Figure 12‑80: Alternate Care Peripheral Intravenous Catheter Market by Segment, Europe, 2019 – 2029 (€M) |
615 |
| Figure 12‑81: Alternate Care Peripheral Intravenous Catheter Market by Segment, Europe, 2019 – 2029 (US$M) |
616 |
| Figure 12‑82: Total Alternate Care Peripheral Intravenous Catheter Market, Europe, 2019 – 2029 |
616 |
| Figure 12‑83: Units Sold by Country, Total Alternate Care Peripheral Intravenous Catheter Market, Europe, 2019 – 2029 (1 of 2) |
617 |
| Figure 12‑84: Units Sold by Country, Total Alternate Care Peripheral Intravenous Catheter Market, Europe, 2019 – 2029 (2 of 2) |
617 |
| Figure 12‑85: Average Selling Price by Country, Total Alternate Care Peripheral Intravenous Catheter Market, Europe, 2019 – 2029 (€) |
618 |
| Figure 12‑86: Average Selling Price by Country, Total Alternate Care Peripheral Intravenous Catheter Market, Europe, 2019 – 2029 (US$) |
619 |
| Figure 12‑87: Market Value by Country, Total Alternate Care Peripheral Intravenous Catheter Market, Europe, 2019 – 2029 (€M) |
620 |
| Figure 12‑88: Market Value by Country, Total Alternate Care Peripheral Intravenous Catheter Market, Europe, 2019 – 2029 (US$M) |
621 |
| Figure 12‑89: Home Care Peripheral Intravenous Catheter Market, Europe, 2019 – 2029 |
622 |
| Figure 12‑90: Units Sold by Country, Home Care Peripheral Intravenous Catheter Market, Europe, 2019 – 2029 |
623 |
| Figure 12‑91: Average Selling Price by Country, Home Care Peripheral Intravenous Catheter Market, Europe, 2019 – 2029 (€) |
624 |
| Figure 12‑92: Average Selling Price by Country, Home Care Peripheral Intravenous Catheter Market, Europe, 2019 – 2029 (US$) |
625 |
| Figure 12‑93: Market Value by Country, Home Care Peripheral Intravenous Catheter Market, Europe, 2019 – 2029 (€M) |
626 |
| Figure 12‑94: Market Value by Country, Home Care Peripheral Intravenous Catheter Market, Europe, 2019 – 2029 (US$M) |
627 |
| Figure 12‑95: Outpatient and Nursing Home Care Peripheral Intravenous Catheter Market, Europe, 2019 – 2029 |
628 |
| Figure 12‑96: Units Sold by Country, Outpatient and Nursing Home Care Peripheral Intravenous Catheter Market, Europe, 2019 – 2029 (1 of 2) |
629 |
| Figure 12‑97: Units Sold by Country, Outpatient and Nursing Home Care Peripheral Intravenous Catheter Market, Europe, 2019 – 2029 (2 of 2) |
629 |
| Figure 12‑98: Average Selling Price by Country, Outpatient and Nursing Home Care Peripheral Intravenous Catheter Market, Europe, 2019 – 2029 (€) |
630 |
| Figure 12‑99: Average Selling Price by Country, Outpatient and Nursing Home Care Peripheral Intravenous Catheter Market, Europe, 2019 – 2029 (US$) |
631 |
| Figure 12‑100: Market Value by Country, Outpatient and Nursing Home Care Peripheral Intravenous Catheter Market, Europe, 2019 – 2029 (€M) |
632 |
| Figure 12‑101: Market Value by Country, Outpatient and Nursing Home Care Peripheral Intravenous Catheter Market, Europe, 2019 – 2029 (US$M) |
633 |
| Figure 12‑102: Leading Competitors by Country, Peripheral Intravenous Catheter Market, Europe, 2022 |
639 |
| Figure 13‑1: Midline Market by Segment, Europe, 2019 – 2029 (€M) |
643 |
| Figure 13‑2: Midline Market by Segment, Europe, 2019 – 2029 (US$M) |
643 |
| Figure 13‑3: Total Midline Market, Europe, 2019 – 2029 |
646 |
| Figure 13‑4: Units Sold by Country, Midline Market, Europe, 2019 – 2029 |
647 |
| Figure 13‑5: Average Selling Price by Country, Midline Market, Europe, 2019 – 2029 (€) |
648 |
| Figure 13‑6: Average Selling Price by Country, Midline Market, Europe, 2019 – 2029 (US$) |
649 |
| Figure 13‑7: Market Value by Country, Midline Market, Europe, 2019 – 2029 (€M) |
650 |
| Figure 13‑8: Market Value by Country, Midline Market, Europe, 2019 – 2029 (US$M) |
651 |
| Figure 13‑9: MST Midline Market by Segment, Europe, 2019 – 2029 (€M) |
653 |
| Figure 13‑10: MST Midline Market by Segment, Europe, 2019 – 2029 (US$M) |
653 |
| Figure 13‑11: Total MST Midline Market, Europe, 2019 – 2029 |
654 |
| Figure 13‑12: Units Sold by Country, Total MST Midline Market, Europe, 2019 – 2029 |
655 |
| Figure 13‑13: Average Selling Price by Country, Total MST Midline Market, Europe, 2019 – 2029 (€) |
656 |
| Figure 13‑14: Average Selling Price by Country, Total MST Midline Market, Europe, 2019 – 2029 (US$) |
657 |
| Figure 13‑15: Market Value by Country, Total MST Midline Market, Europe, 2019 – 2029 (€M) |
658 |
| Figure 13‑16: Market Value by Country, Total MST Midline Market, Europe, 2019 – 2029 (US$M) |
659 |
| Figure 13‑17: Power-Injectable MST Midline Catheter Market, Europe, 2019 – 2029 |
660 |
| Figure 13‑18: Units Sold by Country, Power-Injectable MST Midline Catheter Market, Europe, 2019 – 2029 |
661 |
| Figure 13‑19: Average Selling Price by Country, Power-Injectable MST Midline Catheter Market, Europe, 2019 – 2029 (€) |
662 |
| Figure 13‑20: Average Selling Price by Country, Power-Injectable MST Midline Catheter Market, Europe, 2019 – 2029 (US$) |
663 |
| Figure 13‑21: Market Value by Country, Power-Injectable MST Midline Catheter Market, Europe, 2019 – 2029 (€M) |
664 |
| Figure 13‑22: Market Value by Country, Power-Injectable MST Midline Catheter Market, Europe, 2019 – 2029 (US$M) |
665 |
| Figure 13‑23: Non-Power-Injectable MST Midline Catheter Market, Europe, 2019 – 2029 |
666 |
| Figure 13‑24: Units Sold by Country, Non-Power-Injectable MST Midline Catheter Market, Europe, 2019 – 2029 |
667 |
| Figure 13‑25: Average Selling Price by Country, Non-Power-Injectable MST Midline Catheter Market, Europe, 2019 – 2029 (€) |
668 |
| Figure 13‑26: Average Selling Price by Country, Non-Power-Injectable MST Midline Catheter Market, Europe, 2019 – 2029 (US$) |
669 |
| Figure 13‑27: Market Value by Country, Non-Power-Injectable MST Midline Catheter Market, Europe, 2019 – 2029 (€M) |
670 |
| Figure 13‑28: Market Value by Country, Non-Power-Injectable MST Midline Catheter Market, Europe, 2019 – 2029 (US$M) |
671 |
| Figure 13‑29: AST Midline Market, Europe, 2019 – 2029 |
673 |
| Figure 13‑30: Units Sold by Country, AST Midline Market, Europe, 2019 – 2029 |
674 |
| Figure 13‑31: Average Selling Price by Country, AST Midline Market, Europe, 2019 – 2029 (€) |
675 |
| Figure 13‑32: Average Selling Price by Country, AST Midline Market, Europe, 2019 – 2029 (US$) |
676 |
| Figure 13‑33: Market Value by Country, AST Midline Market, Europe, 2019 – 2029 (€M) |
677 |
| Figure 13‑34: Market Value by Country, AST Midline Market, Europe, 2019 – 2029 (US$M) |
678 |
| Figure 13‑35: Leading Competitors, Midline Market, Europe, 2022 |
683 |
| Figure 13‑36: Leading Competitors by Country, Midline Market, Europe, 2022 |
684 |
| Figure 14‑1: Extended Dwell Catheter Market, Europe, 2019 – 2029 |
688 |
| Figure 14‑2: Units Sold by Country, Extended Dwell Catheter Market, Europe, 2019 – 2029 |
690 |
| Figure 14‑3: Average Selling Price by Country, Extended Dwell Catheter Market, Europe, 2019 – 2029 (€) |
691 |
| Figure 14‑4: Average Selling Price by Country, Extended Dwell Catheter Market, Europe, 2019 – 2029 (US$) |
692 |
| Figure 14‑5: Market Value by Country, Extended Dwell Catheter Market, Europe, 2019 – 2029 (€M) |
693 |
| Figure 14‑6: Market Value by Country, Extended Dwell Catheter Market, Europe, 2019 – 2029 (US$M) |
694 |
| Figure 14‑7: Leading Competitors, Extended Dwell Catheter Market, Europe, 2022 |
698 |
| Figure 15‑1: Dialysis Catheter Market by Segment, Europe, 2019 – 2029 (€M) |
702 |
| Figure 15‑2: Dialysis Catheter Market by Segment, Europe, 2019 – 2029 (US$M) |
702 |
| Figure 15‑3: Hemodialysis Catheter Market by Segment, Europe, 2019 – 2029 (€M) |
704 |
| Figure 15‑4: Hemodialysis Catheter Market by Segment, Europe, 2019 – 2029 (US$M) |
705 |
| Figure 15‑5: Total Hemodialysis Catheter Market, Europe, 2019 – 2029 |
705 |
| Figure 15‑6: Units Sold by Country, Hemodialysis Catheter Market, Europe, 2019 – 2029 |
706 |
| Figure 15‑7: Average Selling Price by Country, Hemodialysis Catheter Market, Europe, 2019 – 2029 (€) |
707 |
| Figure 15‑8: Average Selling Price by Country, Hemodialysis Catheter Market, Europe, 2019 – 2029 (US$) |
708 |
| Figure 15‑9: Market Value by Country, Hemodialysis Catheter Market, Europe, 2019 – 2029 (€M) |
709 |
| Figure 15‑10: Market Value by Country, Hemodialysis Catheter Market, Europe, 2019 – 2029 (US$M) |
710 |
| Figure 15‑11: Long-Term Hemodialysis Catheter Market by Segment, Europe, 2019 – 2029 (€M) |
712 |
| Figure 15‑12: Long-Term Hemodialysis Catheter Market by Segment, Europe, 2019 – 2029 (US$M) |
712 |
| Figure 15‑13: Total Long-Term Hemodialysis Catheter Market, Europe, 2019 – 2029 |
713 |
| Figure 15‑14: Units Sold by Country, Total Long-Term Hemodialysis Catheter Market, Europe, 2019 – 2029 |
714 |
| Figure 15‑15: Average Selling Price by Country, Total Long-Term Hemodialysis Catheter Market, Europe, 2019 – 2029 (€) |
715 |
| Figure 15‑16: Average Selling Price by Country, Total Long-Term Hemodialysis Catheter Market, Europe, 2019 – 2029 (US$) |
716 |
| Figure 15‑17: Market Value by Country, Total Long-Term Hemodialysis Catheter Market, Europe, 2019 – 2029 (€M) |
717 |
| Figure 15‑18: Market Value by Country, Total Long-Term Hemodialysis Catheter Market, Europe, 2019 – 2029 (US$M) |
718 |
| Figure 15‑19: Conventional Long-Term Hemodialysis Catheter Market, Europe, 2019 – 2029 |
719 |
| Figure 15‑20: Units Sold by Country, Conventional Long-Term Hemodialysis Catheter Market, Europe, 2019 – 2029 |
720 |
| Figure 15‑21: Average Selling Price by Country, Conventional Long-Term Hemodialysis Catheter Market, Europe, 2019 – 2029 (€) |
721 |
| Figure 15‑22: Average Selling Price by Country, Conventional Long-Term Hemodialysis Catheter Market, Europe, 2019 – 2029 (US$) |
722 |
| Figure 15‑23: Market Value by Country, Conventional Long-Term Hemodialysis Catheter Market, Europe, 2019 – 2029 (€M) |
723 |
| Figure 15‑24: Market Value by Country, Conventional Long-Term Hemodialysis Catheter Market, Europe, 2019 – 2029 (US$M) |
724 |
| Figure 15‑25: Antimicrobial Long-Term Hemodialysis Catheter Market, Europe, 2019 – 2029 |
726 |
| Figure 15‑26: Units Sold by Country, Antimicrobial Long-Term Hemodialysis Catheter Market, Europe, 2019 – 2029 |
727 |
| Figure 15‑27: Average Selling Price by Country, Antimicrobial Long-Term Hemodialysis Catheter Market, Europe, 2019 – 2029 (€) |
728 |
| Figure 15‑28: Average Selling Price by Country, Antimicrobial Long-Term Hemodialysis Catheter Market, Europe, 2019 – 2029 (US$) |
729 |
| Figure 15‑29: Market Value by Country, Antimicrobial Long-Term Hemodialysis Catheter Market, Europe, 2019 – 2029 (€M) |
730 |
| Figure 15‑30: Market Value by Country, Antimicrobial Long-Term Hemodialysis Catheter Market, Europe, 2019 – 2029 (US$M) |
731 |
| Figure 15‑31: Short-Term Hemodialysis Catheter Market by Segment, Europe, 2019 – 2029 (€M) |
733 |
| Figure 15‑32: Short-Term Hemodialysis Catheter Market by Segment, Europe, 2019 – 2029 (US$M) |
733 |
| Figure 15‑33: Total Short-Term Hemodialysis Catheter Market, Europe, 2019 – 2029 |
734 |
| Figure 15‑34: Units Sold by Country, Total Short-Term Hemodialysis Catheter Market, Europe, 2019 – 2029 |
735 |
| Figure 15‑35: Average Selling Price by Country, Total Short-Term Hemodialysis Catheter Market, Europe, 2019 – 2029 (€) |
736 |
| Figure 15‑36: Average Selling Price by Country, Total Short-Term Hemodialysis Catheter Market, Europe, 2019 – 2029 (US$) |
737 |
| Figure 15‑37: Market Value by Country, Total Short-Term Hemodialysis Catheter Market, Europe, 2019 – 2029 (€M) |
738 |
| Figure 15‑38: Market Value by Country, Total Short-Term Hemodialysis Catheter Market, Europe, 2019 – 2029 (US$M) |
739 |
| Figure 15‑39: Power-Injectable Short-Term Hemodialysis Catheter Market, Europe, 2019 – 2029 |
740 |
| Figure 15‑40: Units Sold by Country, Power-Injectable Short-Term Hemodialysis Catheter Market, Europe, 2019 – 2029 |
741 |
| Figure 15‑41: Average Selling Price by Country, Power-Injectable Short-Term Hemodialysis Catheter Market, Europe, 2019 – 2029 (€) |
742 |
| Figure 15‑42: Average Selling Price by Country, Power-Injectable Short-Term Hemodialysis Catheter Market, Europe, 2019 – 2029 (US$) |
743 |
| Figure 15‑43: Market Value by Country, Power-Injectable Short-Term Hemodialysis Catheter Market, Europe, 2019 – 2029 (€M) |
744 |
| Figure 15‑44: Market Value by Country, Power-Injectable Short-Term Hemodialysis Catheter Market, Europe, 2019 – 2029 (US$M) |
745 |
| Figure 15‑45: Non-Power-Injectable Short-Term Hemodialysis Catheter Market, Europe, 2019 – 2029 |
746 |
| Figure 15‑46: Units Sold by Country, Non-Power-Injectable Short-Term Hemodialysis Catheter Market, Europe, 2019 – 2029 |
747 |
| Figure 15‑47: Average Selling Price by Country, Non-Power-Injectable Short-Term Hemodialysis Catheter Market, Europe, 2019 – 2029 (€) |
748 |
| Figure 15‑48: Average Selling Price by Country, Non-Power-Injectable Short-Term Hemodialysis Catheter Market, Europe, 2019 – 2029 (US$) |
749 |
| Figure 15‑49: Market Value by Country, Non-Power-Injectable Short-Term Hemodialysis Catheter Market, Europe, 2019 – 2029 (€M) |
750 |
| Figure 15‑50: Market Value by Country, Non-Power-Injectable Short-Term Hemodialysis Catheter Market, Europe, 2019 – 2029 (US$M) |
751 |
| Figure 15‑51: Peritoneal Dialysis Catheter Market, Europe, 2019 – 2029 |
753 |
| Figure 15‑52: Units Sold by Country, Peritoneal Dialysis Catheter Market, Europe, 2019 – 2029 |
754 |
| Figure 15‑53: Average Selling Price by Country, Peritoneal Dialysis Catheter Market, Europe, 2019 – 2029 (€) |
755 |
| Figure 15‑54: Average Selling Price by Country, Peritoneal Dialysis Catheter Market, Europe, 2019 – 2029 (US$) |
756 |
| Figure 15‑55: Market Value by Country, Peritoneal Dialysis Catheter Market, Europe, 2019 – 2029 (€M) |
757 |
| Figure 15‑56: Market Value by Country, Peritoneal Dialysis Catheter Market, Europe, 2019 – 2029 (US$M) |
758 |
| Figure 15‑57: Leading Competitors, Dialysis Catheter Market, Europe, 2022 |
765 |
| Figure 15‑58: Leading Competitors by Country, Dialysis Catheter Market, Europe, 2022 |
766 |
| Figure 16‑1: Ultrasound System Specialized for Vascular Access Market, Europe, 2019 – 2029 |
771 |
| Figure 16‑2: Units Sold by Country, Ultrasound System Specialized for Vascular Access Market, Europe, 2019 – 2029 |
772 |
| Figure 16‑3: Average Selling Price by Country, Ultrasound System Specialized for Vascular Access Market, Europe, 2019 – 2029 (€) |
773 |
| Figure 16‑4: Average Selling Price by Country, Ultrasound System Specialized for Vascular Access Market, Europe, 2019 – 2029 (US$) |
774 |
| Figure 16‑5: Market Value by Country, Ultrasound System Specialized for Vascular Access Market, Europe, 2019 – 2029 (€M) |
775 |
| Figure 16‑6: Market Value by Country, Ultrasound System Specialized for Vascular Access Market, Europe, 2019 – 2029 (US$M) |
776 |
| Figure 16‑7: Leading Competitors, Ultrasound Vascular Access Device Market, Europe, 2022 |
780 |
| Figure 17‑1: Tip-Placement System and Accessory Market, Europe, 2019 – 2029 |
784 |
| Figure 17‑2: Units Sold by Country, Tip-Placement System and Accessory Market, Europe, 2019 – 2029 |
786 |
| Figure 17‑3: Average Selling Price by Country, Tip-Placement System and Accessory Market, Europe, 2019 – 2029 (€) |
787 |
| Figure 17‑4: Average Selling Price by Country, Tip-Placement System and Accessory Market, Europe, 2019 – 2029 (US$) |
788 |
| Figure 17‑5: Market Value by Country, Tip-Placement System and Accessory Market, Europe, 2019 – 2029 (€M) |
789 |
| Figure 17‑6: Market Value by Country, Tip-Placement System and Accessory Market, Europe, 2019 – 2029 (US$M) |
790 |
| Figure 17‑7: Leading Competitors, Tip-Placement System and Accessory Market, Europe, 2022 |
794 |
| Figure 18‑1: Catheter Securement Device Market by Segment, Europe, 2019 – 2029 (€M) |
797 |
| Figure 18‑2: Catheter Securement Device Market by Segment, Europe, 2019 – 2029 (US$M) |
798 |
| Figure 18‑3: Total Catheter Securement Device Market, Europe, 2019 – 2029 |
800 |
| Figure 18‑4: Units Sold by Country, Catheter Securement Device Market, Europe, 2019 – 2029 (1 of 2) |
801 |
| Figure 18‑5: Units Sold by Country, Catheter Securement Device Market, Europe, 2019 – 2029 (2 of 2) |
801 |
| Figure 18‑6: Average Selling Price by Country, Catheter Securement Device Market, Europe, 2019 – 2029 (€) |
802 |
| Figure 18‑7: Average Selling Price by Country, Catheter Securement Device Market, Europe, 2019 – 2029 (US$) |
803 |
| Figure 18‑8: Market Value by Country, Catheter Securement Device Market, Europe, 2019 – 2029 (€M) |
804 |
| Figure 18‑9: Market Value by Country, Catheter Securement Device Market, Europe, 2019 – 2029 (US$M) |
805 |
| Figure 18‑10: Tape and Dressing Market by Segment, Europe, 2019 – 2029 (€M) |
807 |
| Figure 18‑11: Tape and Dressing Market by Segment, Europe, 2019 – 2029 (US$M) |
807 |
| Figure 18‑12: Total Tape and Dressing Market, Europe, 2019 – 2029 |
808 |
| Figure 18‑13: Units Sold by Country, Total Tape and Dressing Market, Europe, 2019 – 2029 (1 of 2) |
809 |
| Figure 18‑14: Units Sold by Country, Total Tape and Dressing Market, Europe, 2019 – 2029 (2 of 2) |
809 |
| Figure 18‑15: Average Selling Price by Country, Total Tape and Dressing Market, Europe, 2019 – 2029 (€) |
810 |
| Figure 18‑16: Average Selling Price by Country, Total Tape and Dressing Market, Europe, 2019 – 2029 (US$) |
811 |
| Figure 18‑17: Market Value by Country, Total Tape and Dressing Market, Europe, 2019 – 2029 (€M) |
812 |
| Figure 18‑18: Market Value by Country, Total Tape and Dressing Market, Europe, 2019 – 2029 (US$M) |
813 |
| Figure 18‑19: Antimicrobial Tape and Dressing Market, Europe, 2019 – 2029 |
814 |
| Figure 18‑20: Units Sold by Country, Antimicrobial Tape and Dressing Market, Europe, 2019 – 2029 (1 of 2) |
815 |
| Figure 18‑21: Units Sold by Country, Antimicrobial Tape and Dressing Market, Europe, 2019 – 2029 (2 of 2) |
815 |
| Figure 18‑22: Average Selling Price by Country, Antimicrobial Tape and Dressing Market, Europe, 2019 – 2029 (€) |
816 |
| Figure 18‑23: Average Selling Price by Country, Antimicrobial Tape and Dressing Market, Europe, 2019 – 2029 (US$) |
817 |
| Figure 18‑24: Market Value by Country, Antimicrobial Tape and Dressing Market, Europe, 2019 – 2029 (€M) |
818 |
| Figure 18‑25: Market Value by Country, Antimicrobial Tape and Dressing Market, Europe, 2019 – 2029 (US$M) |
819 |
| Figure 18‑26: Standard Tape and Dressing Market, Europe, 2019 – 2029 |
820 |
| Figure 18‑27: Units Sold by Country, Standard Tape and Dressing Market, Europe, 2019 – 2029 (1 of 2) |
821 |
| Figure 18‑28: Units Sold by Country, Standard Tape and Dressing Market, Europe, 2019 – 2029 (2 of 2) |
821 |
| Figure 18‑29: Average Selling Price by Country, Standard Tape and Dressing Market, Europe, 2019 – 2029 (€) |
822 |
| Figure 18‑30: Average Selling Price by Country, Standard Tape and Dressing Market, Europe, 2019 – 2029 (US$) |
823 |
| Figure 18‑31: Market Value by Country, Standard Tape and Dressing Market, Europe, 2019 – 2029 (€M) |
824 |
| Figure 18‑32: Market Value by Country, Standard Tape and Dressing Market, Europe, 2019 – 2029 (US$M) |
825 |
| Figure 18‑33: Manufactured Catheter Securement Device Market by Segment, Europe, 2019 – 2029 (€M) |
827 |
| Figure 18‑34: Manufactured Catheter Securement Device Market by Segment, Europe, 2019 – 2029 (US$M) |
828 |
| Figure 18‑35: Total Manufactured Catheter Securement Device Market, Europe, 2019 – 2029 |
829 |
| Figure 18‑36: Units Sold by Country, Total Manufactured Catheter Securement Device Market, Europe, 2019 – 2029 (1 of 2) |
830 |
| Figure 18‑37: Units Sold by Country, Total Manufactured Catheter Securement Device Market, Europe, 2019 – 2029 (2 of 2) |
830 |
| Figure 18‑38: Average Selling Price by Country, Total Manufactured Catheter Securement Device Market, Europe, 2019 – 2029 (€) |
831 |
| Figure 18‑39: Average Selling Price by Country, Total Manufactured Catheter Securement Device Market, Europe, 2019 – 2029 (US$) |
832 |
| Figure 18‑40: Market Value by Country, Total Manufactured Catheter Securement Device Market, Europe, 2019 – 2029 (€M) |
833 |
| Figure 18‑41: Market Value by Country, Total Manufactured Catheter Securement Device Market, Europe, 2019 – 2029 (US$M) |
834 |
| Figure 18‑42: Mechanical Manufactured Catheter Securement Device Market, Europe, 2019 – 2029 |
835 |
| Figure 18‑43: Units Sold by Country, Mechanical Manufactured Catheter Securement Device Market, Europe, 2019 – 2029 (1 of 2) |
836 |
| Figure 18‑44: Units Sold by Country, Mechanical Manufactured Catheter Securement Device Market, Europe, 2019 – 2029 (2 of 2) |
836 |
| Figure 18‑45: Average Selling Price by Country, Mechanical Manufactured Catheter Securement Device Market, Europe, 2019 – 2029 (€) |
837 |
| Figure 18‑46: Average Selling Price by Country, Mechanical Manufactured Catheter Securement Device Market, Europe, 2019 – 2029 (US$) |
838 |
| Figure 18‑47: Market Value by Country, Mechanical Manufactured Catheter Securement Device Market, Europe, 2019 – 2029 (€M) |
839 |
| Figure 18‑48: Market Value by Country, Mechanical Manufactured Catheter Securement Device Market, Europe, 2019 – 2029 (US$M) |
840 |
| Figure 18‑49: Non-Mechanical Manufactured Catheter Securement Device Market, Europe, 2019 – 2029 |
841 |
| Figure 18‑50: Units Sold by Country, Non-Mechanical Manufactured Catheter Securement Device Market, Europe, 2019 – 2029 |
842 |
| Figure 18‑51: Average Selling Price by Country, Non-Mechanical Manufactured Catheter Securement Device Market, Europe, 2019 – 2029 (€) |
843 |
| Figure 18‑52: Average Selling Price by Country, Non-Mechanical Manufactured Catheter Securement Device Market, Europe, 2019 – 2029 (US$) |
844 |
| Figure 18‑53: Market Value by Country, Non-Mechanical Manufactured Catheter Securement Device Market, Europe, 2019 – 2029 (€M) |
845 |
| Figure 18‑54: Market Value by Country, Non-Mechanical Manufactured Catheter Securement Device Market, Europe, 2019 – 2029 (US$M) |
846 |
| Figure 18‑55: Leading Competitors, Catheter Securement Device Market, Europe, 2022 |
852 |
| Figure 19‑1: Antibacterial Catheter Patch Market, Europe, 2019 – 2029 |
856 |
| Figure 19‑2: Units Sold by Country, Antibacterial Catheter Patch Market, Europe, 2019 – 2029 |
858 |
| Figure 19‑3: Average Selling Price by Country, Antibacterial Catheter Patch Market, Europe, 2019 – 2029 (€) |
859 |
| Figure 19‑4: Average Selling Price by Country, Antibacterial Catheter Patch Market, Europe, 2019 – 2029 (US$) |
860 |
| Figure 19‑5: Market Value by Country, Antibacterial Catheter Patch Market, Europe, 2019 – 2029 (€M) |
861 |
| Figure 19‑6: Market Value by Country, Antibacterial Catheter Patch Market, Europe, 2019 – 2029 (US$M) |
862 |
| Figure 19‑7: Leading Competitors, Antibacterial Catheter Patch Market, Europe, 2022 |
866 |
| Figure 20‑1: Catheter Cap Market, Europe, 2019 – 2029 |
870 |
| Figure 20‑2: Units Sold by Country, Catheter Cap Market, Europe, 2019 – 2029 (1 of 2) |
872 |
| Figure 20‑3: Units Sold by Country, Catheter Cap Market, Europe, 2019 – 2029 (2 of 2) |
872 |
| Figure 20‑4: Average Selling Price by Country, Catheter Cap Market, Europe, 2019 – 2029 (€) |
873 |
| Figure 20‑5: Average Selling Price by Country, Catheter Cap Market, Europe, 2019 – 2029 (US$) |
874 |
| Figure 20‑6: Market Value by Country, Catheter Cap Market, Europe, 2019 – 2029 (€M) |
875 |
| Figure 20‑7: Market Value by Country, Catheter Cap Market, Europe, 2019 – 2029 (US$M) |
876 |
| Figure 20‑8: Leading Competitors, Catheter Cap Market, Europe, 2022 |
880 |
| Figure 21‑1: Syringe and Needle Market by Segment, Europe, 2019 – 2029 (€M) |
885 |
| Figure 21‑2: Syringe and Needle Market by Segment, Europe, 2019 – 2029 (US$M) |
885 |
| Figure 21‑3: Syringe Market by Segment, Europe, 2019 – 2029 (€M) |
887 |
| Figure 21‑4: Syringe Market by Segment, Europe, 2019 – 2029 (US$M) |
888 |
| Figure 21‑5: Syringe Market, Europe, 2019 – 2029 |
888 |
| Figure 21‑6: Units Sold by Country, Syringe Market, Europe, 2019 – 2029 (1 of 2) |
889 |
| Figure 21‑7: Units Sold by Country, Syringe Market, Europe, 2019 – 2029 (2 of 2) |
889 |
| Figure 21‑8: Average Selling Price by Country, Syringe Market, Europe, 2019 – 2029 (€) |
890 |
| Figure 21‑9: Average Selling Price by Country, Syringe Market, Europe, 2019 – 2029 (US$) |
891 |
| Figure 21‑10: Market Value by Country, Syringe Market, Europe, 2019 – 2029 (€M) |
892 |
| Figure 21‑11: Market Value by Country, Syringe Market, Europe, 2019 – 2029 (US$M) |
893 |
| Figure 21‑12: Conventional Syringe Market by Segment, Europe, 2019 – 2029 (€M) |
895 |
| Figure 21‑13: Conventional Syringe Market by Segment, Europe, 2019 – 2029 (US$M) |
895 |
| Figure 21‑14: Total Conventional Syringe Market, Europe, 2019 – 2029 |
896 |
| Figure 21‑15: Units Sold by Country, Total Conventional Syringe Market, Europe, 2019 – 2029 (1 of 2) |
897 |
| Figure 21‑16: Units Sold by Country, Total Conventional Syringe Market, Europe, 2019 – 2029 (2 of 2) |
897 |
| Figure 21‑17: Average Selling Price by Country, Total Conventional Syringe Market, Europe, 2019 – 2029 (€) |
898 |
| Figure 21‑18: Average Selling Price by Country, Total Conventional Syringe Market, Europe, 2019 – 2029 (US$) |
899 |
| Figure 21‑19: Market Value by Country, Total Conventional Syringe Market, Europe, 2019 – 2029 (€M) |
900 |
| Figure 21‑20: Market Value by Country, Total Conventional Syringe Market, Europe, 2019 – 2029 (US$M) |
901 |
| Figure 21‑21: Two-Part Conventional Syringe Market, Europe, 2019 – 2029 |
903 |
| Figure 21‑22: Units Sold by Country, Two-Part Conventional Syringe Market, Europe, 2019 – 2029 (1 of 2) |
904 |
| Figure 21‑23: Units Sold by Country, Two-Part Conventional Syringe Market, Europe, 2019 – 2029 (2 of 2) |
904 |
| Figure 21‑24: Average Selling Price by Country, Two-Part Conventional Syringe Market, Europe, 2019 – 2029 (€) |
905 |
| Figure 21‑25: Average Selling Price by Country, Two-Part Conventional Syringe Market, Europe, 2019 – 2029 (US$) |
906 |
| Figure 21‑26: Market Value by Country, Two-Part Conventional Syringe Market, Europe, 2019 – 2029 (€M) |
907 |
| Figure 21‑27: Market Value by Country, Two-Part Conventional Syringe Market, Europe, 2019 – 2029 (US$M) |
908 |
| Figure 21‑28: Three-Part Conventional Syringe Market, Europe, 2019 – 2029 |
909 |
| Figure 21‑29: Units Sold by Country, Three-Part Conventional Syringe Market, Europe, 2019 – 2029 (1 of 2) |
910 |
| Figure 21‑30: Units Sold by Country, Three-Part Conventional Syringe Market, Europe, 2019 – 2029 (2 of 2) |
910 |
| Figure 21‑31: Average Selling Price by Country, Three-Part Conventional Syringe Market, Europe, 2019 – 2029 (€) |
911 |
| Figure 21‑32: Average Selling Price by Country, Three-Part Conventional Syringe Market, Europe, 2019 – 2029 (US$) |
912 |
| Figure 21‑33: Market Value by Country, Three-Part Conventional Syringe Market, Europe, 2019 – 2029 (€M) |
913 |
| Figure 21‑34: Market Value by Country, Three-Part Conventional Syringe Market, Europe, 2019 – 2029 (US$M) |
914 |
| Figure 21‑35: Safety Syringe Market by Segment, Europe, 2019 – 2029 (€M) |
916 |
| Figure 21‑36: Safety Syringe Market by Segment, Europe, 2019 – 2029 (US$M) |
916 |
| Figure 21‑37: Total Safety Syringe Market, Europe, 2019 – 2029 |
917 |
| Figure 21‑38: Units Sold by Country, Total Safety Syringe Market, Europe, 2019 – 2029 |
918 |
| Figure 21‑39: Average Selling Price by Country, Total Safety Syringe Market, Europe, 2019 – 2029 (€) |
919 |
| Figure 21‑40: Average Selling Price by Country, Total Safety Syringe Market, Europe, 2019 – 2029 (US$) |
920 |
| Figure 21‑41: Market Value by Country, Total Safety Syringe Market, Europe, 2019 – 2029 (€M) |
921 |
| Figure 21‑42: Market Value by Country, Total Safety Syringe Market, Europe, 2019 – 2029 (US$M) |
922 |
| Figure 21‑43: Two-Part Safety Syringe Market, Europe, 2019 – 2029 |
923 |
| Figure 21‑44: Units Sold by Country, Two-Part Safety Syringe Market, Europe, 2019 – 2029 |
924 |
| Figure 21‑45: Average Selling Price by Country, Two-Part Safety Syringe Market, Europe, 2019 – 2029 (€) |
925 |
| Figure 21‑46: Average Selling Price by Country, Two-Part Safety Syringe Market, Europe, 2019 – 2029 (US$) |
926 |
| Figure 21‑47: Market Value by Country, Two-Part Safety Syringe Market, Europe, 2019 – 2029 (€M) |
927 |
| Figure 21‑48: Market Value by Country, Two-Part Safety Syringe Market, Europe, 2019 – 2029 (US$M) |
928 |
| Figure 21‑49: Three-Part Safety Syringe Market, Europe, 2019 – 2029 |
929 |
| Figure 21‑50: Units Sold by Country, Three-Part Safety Syringe Market, Europe, 2019 – 2029 |
930 |
| Figure 21‑51: Average Selling Price by Country, Three-Part Safety Syringe Market, Europe, 2019 – 2029 (€) |
931 |
| Figure 21‑52: Average Selling Price by Country, Three-Part Safety Syringe Market, Europe, 2019 – 2029 (US$) |
932 |
| Figure 21‑53: Market Value by Country, Three-Part Safety Syringe Market, Europe, 2019 – 2029 (€M) |
933 |
| Figure 21‑54: Market Value by Country, Three-Part Safety Syringe Market, Europe, 2019 – 2029 (US$M) |
934 |
| Figure 21‑55: Insulin Syringe Market by Segment, Europe, 2019 – 2029 (€M) |
936 |
| Figure 21‑56: Insulin Syringe Market by Segment, Europe, 2019 – 2029 (US$M) |
936 |
| Figure 21‑57: Total Insulin Syringe Market, Europe, 2019 – 2029 |
937 |
| Figure 21‑58: Units Sold by Country, Total Insulin Syringe Market, Europe, 2019 – 2029 (1 of 2) |
938 |
| Figure 21‑59: Units Sold by Country, Total Insulin Syringe Market, Europe, 2019 – 2029 (2 of 2) |
938 |
| Figure 21‑60: Average Selling Price by Country, Total Insulin Syringe Market, Europe, 2019 – 2029 (€) |
939 |
| Figure 21‑61: Average Selling Price by Country, Total Insulin Syringe Market, Europe, 2019 – 2029 (US$) |
940 |
| Figure 21‑62: Market Value by Country, Total Insulin Syringe Market, Europe, 2019 – 2029 (€M) |
941 |
| Figure 21‑63: Market Value by Country, Total Insulin Syringe Market, Europe, 2019 – 2029 (US$M) |
942 |
| Figure 21‑64: Insulin Syringe with Needle Market, Europe, 2019 – 2029 |
943 |
| Figure 21‑65: Units Sold by Country, Insulin Syringe with Needle Market, Europe, 2019 – 2029 (1 of 2) |
944 |
| Figure 21‑66: Units Sold by Country, Insulin Syringe with Needle Market, Europe, 2019 – 2029 (2 of 2) |
944 |
| Figure 21‑67: Average Selling Price by Country, Insulin Syringe with Needle Market, Europe, 2019 – 2029 (€) |
945 |
| Figure 21‑68: Average Selling Price by Country, Insulin Syringe with Needle Market, Europe, 2019 – 2029 (US$) |
946 |
| Figure 21‑69: Market Value by Country, Insulin Syringe with Needle Market, Europe, 2019 – 2029 (€M) |
947 |
| Figure 21‑70: Market Value by Country, Insulin Syringe with Needle Market, Europe, 2019 – 2029 (US$M) |
948 |
| Figure 21‑71: Insulin Syringe without Needle Market, Europe, 2019 – 2029 |
949 |
| Figure 21‑72: Units Sold by Country, Insulin Syringe without Needle Market, Europe, 2019 – 2029 (1 of 2) |
950 |
| Figure 21‑73: Units Sold by Country, Insulin Syringe without Needle Market, Europe, 2019 – 2029 (2 of 2) |
950 |
| Figure 21‑74: Average Selling Price by Country, Insulin Syringe without Needle Market, Europe, 2019 – 2029 (€) |
951 |
| Figure 21‑75: Average Selling Price by Country, Insulin Syringe without Needle Market, Europe, 2019 – 2029 (US$) |
952 |
| Figure 21‑76: Market Value by Country, Insulin Syringe without Needle Market, Europe, 2019 – 2029 (€M) |
953 |
| Figure 21‑77: Market Value by Country, Insulin Syringe without Needle Market, Europe, 2019 – 2029 (US$M) |
954 |
| Figure 21‑78: Needle Market by Segment, Europe, 2019 – 2029 (€M) |
956 |
| Figure 21‑79: Needle Market by Segment, Europe, 2019 – 2029 (US$M) |
956 |
| Figure 21‑80: Needle Market, Europe, 2019 – 2029 |
957 |
| Figure 21‑81: Units Sold by Country, Needle Market, Europe, 2019 – 2029 (1 of 2) |
958 |
| Figure 21‑82: Units Sold by Country, Needle Market, Europe, 2019 – 2029 (2 of 2) |
958 |
| Figure 21‑83: Average Selling Price by Country, Needle Market, Europe, 2019 – 2029 (€) |
959 |
| Figure 21‑84: Average Selling Price by Country, Needle Market, Europe, 2019 – 2029 (US$) |
960 |
| Figure 21‑85: Market Value by Country, Needle Market, Europe, 2019 – 2029 (€M) |
961 |
| Figure 21‑86: Market Value by Country, Needle Market, Europe, 2019 – 2029 (US$M) |
962 |
| Figure 21‑87: Conventional Needle Market, Europe, 2019 – 2029 |
964 |
| Figure 21‑88: Units Sold by Country, Conventional Needle Market, Europe, 2019 – 2029 (1 of 2) |
965 |
| Figure 21‑89: Units Sold by Country, Conventional Needle Market, Europe, 2019 – 2029 (2 of 2) |
965 |
| Figure 21‑90: Average Selling Price by Country, Conventional Needle Market, Europe, 2019 – 2029 (€) |
966 |
| Figure 21‑91: Average Selling Price by Country, Conventional Needle Market, Europe, 2019 – 2029 (US$) |
967 |
| Figure 21‑92: Market Value by Country, Conventional Needle Market, Europe, 2019 – 2029 (€M) |
968 |
| Figure 21‑93: Market Value by Country, Conventional Needle Market, Europe, 2019 – 2029 (US$M) |
969 |
| Figure 21‑94: Safety Needle Market, Europe, 2019 – 2029 |
971 |
| Figure 21‑95: Units Sold by Country, Safety Needle Market, Europe, 2019 – 2029 (1 of 2) |
972 |
| Figure 21‑96: Units Sold by Country, Safety Needle Market, Europe, 2019 – 2029 (2 of 2) |
972 |
| Figure 21‑97: Average Selling Price by Country, Safety Needle Market, Europe, 2019 – 2029 (€) |
973 |
| Figure 21‑98: Average Selling Price by Country, Safety Needle Market, Europe, 2019 – 2029 (US$) |
974 |
| Figure 21‑99: Market Value by Country, Safety Needle Market, Europe, 2019 – 2029 (€M) |
975 |
| Figure 21‑100: Market Value by Country, Safety Needle Market, Europe, 2019 – 2029 (US$M) |
976 |
| Figure 21‑101: Blunt Fill Needle Market, Europe, 2019 – 2029 |
977 |
| Figure 21‑102: Units Sold by Country, Blunt Fill Needle Market, Europe, 2019 – 2029 (1 of 2) |
978 |
| Figure 21‑103: Units Sold by Country, Blunt Fill Needle Market, Europe, 2019 – 2029 (2 of 2) |
978 |
| Figure 21‑104: Average Selling Price by Country, Blunt Fill Needle Market, Europe, 2019 – 2029 (€) |
979 |
| Figure 21‑105: Average Selling Price by Country, Blunt Fill Needle Market, Europe, 2019 – 2029 (US$) |
980 |
| Figure 21‑106: Market Value by Country, Blunt Fill Needle Market, Europe, 2019 – 2029 (€M) |
981 |
| Figure 21‑107: Market Value by Country, Blunt Fill Needle Market, Europe, 2019 – 2029 (US$M) |
982 |
| Figure 21‑108: Insulin Pen Needle Market by Segment, Europe, 2019 – 2029 (€M) |
983 |
| Figure 21‑109: Insulin Pen Needle Market by Segment, Europe, 2019 – 2029 (US$M) |
984 |
| Figure 21‑110: Total Insulin Pen Needle Market, Europe, 2019 – 2029 |
984 |
| Figure 21‑111: Units Sold by Country, Total Insulin Pen Needle Market, Europe, 2019 – 2029 (1 of 2) |
985 |
| Figure 21‑112: Units Sold by Country, Total Insulin Pen Needle Market, Europe, 2019 – 2029 (2 of 2) |
985 |
| Figure 21‑113: Average Selling Price by Country, Total Insulin Pen Needle Market, Europe, 2019 – 2029 (€) |
986 |
| Figure 21‑114: Average Selling Price by Country, Total Insulin Pen Needle Market, Europe, 2019 – 2029 (US$) |
987 |
| Figure 21‑115: Market Value by Country, Total Insulin Pen Needle Market, Europe, 2019 – 2029 (€M) |
988 |
| Figure 21‑116: Market Value by Country, Total Insulin Pen Needle Market, Europe, 2019 – 2029 (US$M) |
989 |
| Figure 21‑117: Conventional Insulin Pen Needle Market, Europe, 2019 – 2029 |
990 |
| Figure 21‑118: Units Sold by Country, Conventional Insulin Pen Needle Market, Europe, 2019 – 2029 (1 of 2) |
991 |
| Figure 21‑119: Units Sold by Country, Conventional Insulin Pen Needle Market, Europe, 2019 – 2029 (2 of 2) |
991 |
| Figure 21‑120: Average Selling Price by Country, Conventional Insulin Pen Needle Market, Europe, 2019 – 2029 (€) |
992 |
| Figure 21‑121: Average Selling Price by Country, Conventional Insulin Pen Needle Market, Europe, 2019 – 2029 (US$) |
993 |
| Figure 21‑122: Market Value by Country, Conventional Insulin Pen Needle Market, Europe, 2019 – 2029 (€M) |
994 |
| Figure 21‑123: Market Value by Country, Conventional Insulin Pen Needle Market, Europe, 2019 – 2029 (US$M) |
995 |
| Figure 21‑124: Safety Insulin Pen Needle Market, Europe, 2019 – 2029 |
996 |
| Figure 21‑125: Units Sold by Country, Safety Insulin Pen Needle Market, Europe, 2019 – 2029 (1 of 2) |
997 |
| Figure 21‑126: Units Sold by Country, Safety Insulin Pen Needle Market, Europe, 2019 – 2029 (2 of 2) |
997 |
| Figure 21‑127: Average Selling Price by Country, Safety Insulin Pen Needle Market, Europe, 2019 – 2029 (€) |
998 |
| Figure 21‑128: Average Selling Price by Country, Safety Insulin Pen Needle Market, Europe, 2019 – 2029 (US$) |
999 |
| Figure 21‑129: Market Value by Country, Safety Insulin Pen Needle Market, Europe, 2019 – 2029 (€M) |
1000 |
| Figure 21‑130: Market Value by Country, Safety Insulin Pen Needle Market, Europe, 2019 – 2029 (US$M) |
1001 |
| Figure 21‑131: Leading Competitors, Syringe and Needle Market, Europe, 2022 |
1009 |
| Figure 21‑132: Leading Competitors by Country, Syringe and Needle Market, Europe, 2022 |
1011 |
| Figure 22‑1: Vein Visualization Market, Europe, 2019 – 2029 |
1014 |
| Figure 22‑2: Units Sold by Country, Vein Visualization Market, Europe, 2019 – 2029 |
1016 |
| Figure 22‑3: Average Selling Price by Country, Vein Visualization Market, Europe, 2019 – 2029 (€) |
1017 |
| Figure 22‑4: Average Selling Price by Country, Vein Visualization Market, Europe, 2019 – 2029 (US$) |
1018 |
| Figure 22‑5: Market Value by Country, Vein Visualization Market, Europe, 2019 – 2029 (€M) |
1019 |
| Figure 22‑6: Market Value by Country, Vein Visualization Market, Europe, 2019 – 2029 (US$M) |
1020 |
| Figure 22‑7: Leading Competitors, Vein Visualization Market, Europe, 2022 |
1024 |
|
|